Bursting
Bubble?
Gold Mining Stocks Are Surging on Global Economic Fears
Bond yields are crashing in major markets all around the world as fears of a global economic slowdown have prompted investors to seek shelter in low-risk government debt. Both Germany and Japan’s 10-year bond yields are back below zero, marking the first time we’ve seen German yields turn negative since October 2016. As I shared with you last week, the pool of negative-yielding bonds around the globe now stands at a post-2017 high of $9.32 trillion. Yields in Australia and New Zealand have also fallen to record lows, according to Bloomberg.
The Yield Curve Just Inverted. Time to Get Defensive?
Here in the U.S., the yield on the 10-year Treasury has fallen to a more-than-one-year low on a dovish Federal Reserve. As you no doubt know by now, late last week, one very important part of the yield curve inverted for the first time since late 2006. On Tuesday morning, the 10-year Treasury was yielding 2.43 percent, compared to 2.46 percent for the 3-month Treasury—a small but meaningful spread of negative 3 basis points.
A yield curve inversion indicates that investors are anticipating a rate cut in the near future, which itself is a possible sign that economic growth is slowing. As such, inversions have been among the most reliable forecasters of recessions—at least here in the U.S., where each of the past seven recessions were preceded by an inversion.
One of the best defensive positions, I believe, is gold bullion and gold mining stocks, which in the past have traded inversely to yields. When yields have risen, indicating less demand for a safe haven, gold prices have sunk. And when yields have fallen, indicating a risk-off sentiment, gold prices have climbed.
DYI: Gold prices moving inversely with treasury
yields, is not entirely correct.
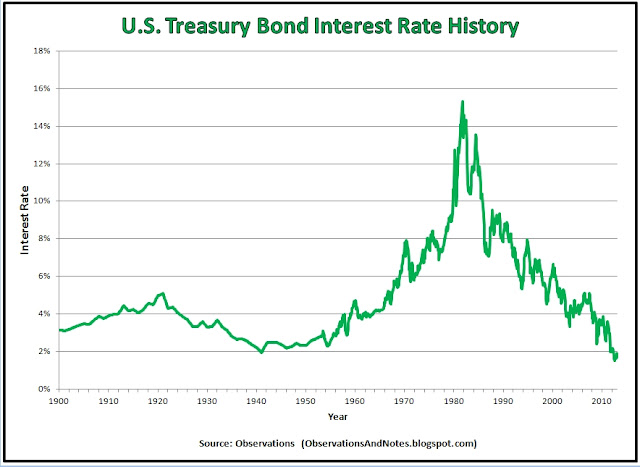
Interest rates continuously moved downward from September of 1981 at
15.32% till July of 2016 at 1.50% and yet from 1980 to 2002 gold was in a bear
market. What is missing in his analysis
is the Dow/Gold Ratio. Back in 1980 gold
peaked at almost a 1 for 1 ratio with the Dow showing very clearly gold had
ended its secular bull and had turned bearish.

Dow/Gold Ratio as of 3/29/19
20 to 1

10 year T-Bond as of 3/29/19
2.39%
Back
in 1980 gold peaked at almost a 1 for 1 Dow/Gold Ratio showing very clearly
gold had ended its secular bull and had turned bearish. And off to the races with a massive bull
market for stocks till the year 2000. Of
course nothing is forever and gold’s bear market ended around the same time as
stocks were peaking clearly seen as overvaluation for stocks and massive
undervaluation for gold with the Dow/Gold Ratio around 48 to 1.
Today
the Dow/Gold Ratio is trading around its mean.
It is my judgment due to overvaluation measured by the Shiller PE at 30.29
to 1 stocks are way overvalued for gold/silver and the precious metals mining
companies to have another upside run.

Shiller PE as of 3/29/19
30.29
Whether this is the beginning is to be seen. However DYI is well positioned with 34%
position for our model portfolio.
Updated Monthly
AGGRESSIVE PORTFOLIO - ACTIVE ALLOCATION - 03/1/19
PAST PERFORMANCE IS NO GUARANTEE OF FUTURE RESULTS.
DYI
No comments:
Post a Comment