John P. Hussman, Ph.D.
Valuations remain extreme on the basis of measures most tightly correlated with subsequent 10-12 year S&P 500 total returns in market cycles across history (see Rarefied Air: Valuations and Subsequent Market Returns). When investors are inclined toward speculation, as evidenced by indiscriminately uniform market action across risk-assets, even obscene overvaluation can be followed by further risk-seeking (see The Hinge). At present, however, market internals have deteriorated substantially, including spiking credit spreads in the debt markets. Beyond those factors, we also observe evidence of an oncoming global economic downturn, including a U.S. recession (see A Growing Risk of Recession, and An Imminent Likelihood of Recession).
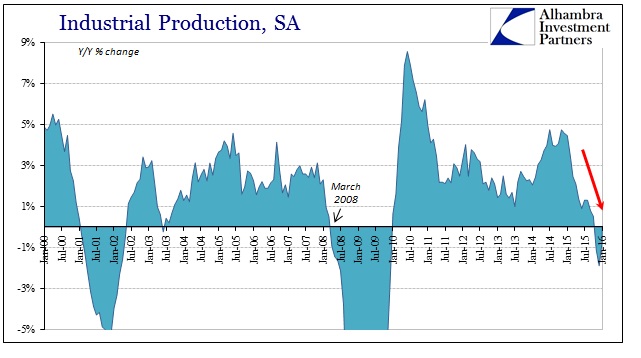
Recession Ahead: Faltering Industrial Production Trend’s Leaving Little Doubt
Warning with a Capital "W"
Worse, those who don’t recognize how easily the 3.2% nominal annual total return of the S&P 500 since 2000 is likely to be completely wiped away over the completion of the current market cycle; who believe that the investment merit of stocks is wholly independent of valuations or the risk-preferences of investors; and who don’t recognize how quickly the standing of risk-managed strategies can shift relative to long-only strategies over the cold winter that completes a market cycle (see in particular Chumps, Champs and Bamboo) – those investors may not know Jack Frost, but will be introduced soon enough.DYI Comments: Stocks and junk bonds are highly correlated to prosperity take that away (recession) prices come tumbling down! How far? Higher the valuation bigger the drop. Currently today valuation are so high for stocks and long term high quality bonds DYI's formula has "kick us out" of these two markets and rightfully so!
2-1-2016
AGGRESSIVE PORTFOLIO - ACTIVE ALLOCATION
Active Allocation Bands (excluding cash) 0% to 60%
83% - Cash -Short Term Bond Index - VBIRX
17% - Gold - Precious Metals & Mining - VGPMX
0% - Lt. Bonds - Long Term Bond Index - VBLTX
0% - Stocks - Total Stock Market Index Fund - VTSAX
[See Disclaimer]
Below are the numbers for the Dow Price to Dividend Ratio and it becomes quite obvious why DYI has marked the year 2000 as a secular top for stocks. Each successful market top's price to dividends is reduced as the market as a whole "mean reverts" all the way back to massive undervaluation.

Dow's current price to dividend ratio is 36 to 1
Secular Market Top - Since January 2000
+ 43.2% Dow
+132.0% Transports
+115.8% Utilities
+32.1% S&P 500
+13.4% Nasdaq
+57.4% 30yr Treasury Bond
+285.5% Gold
From High to Low
+285.5% Gold
+132.0% Transports
+115.8% Utilities
+ 57.4% 30 Year Treasury
+ 43.2% Dow
+ 32.1% S&P 500
+ 31.3% Oil
+ 31.3% Oil
+ 13.4% Nasdaq
The premise for stock, Lt. bonds, gold, and cash there is a bull market among one or two of these asset categories. Currently today world wide central banks have "jacked up" almost all asset categories. However, Mr. Market in the long run is always more powerful than any central bank as oil/gas/service companies and precious metals mining stocks have sold off dramatically. Precious metals mining stocks have been decimated providing an excellent opportunity to dollar cost average into both of these areas.
Keep your powder dry better values for dividend yields and bond yields will avail themselves in the months and years ahead, allowing the long term investor to increase their holdings to improve your compounding.
The Great Wait Continues....
DYI
No comments:
Post a Comment