Saturday, February 29, 2020

DYI:  Valuation remains grotesquely high despite a 14% drop in the Dow Jones Average our model account remains almost unchanged only a small reduction in gold from 50% to 45% boosting cash to 55%. 

Updated Monthly

AGGRESSIVE PORTFOLIO - ACTIVE ALLOCATION - 3/1/20

Active Allocation Bands (excluding cash) 0% to 50%
55% - Cash -Short Term Bond Index - VBIRX
45% -Gold- Global Capital Cycles Fund - VGPMX **
 0% -Lt. Bonds- Long Term Bond Index - VBLTX
 0% -Stocks- Total Stock Market Index - VTSAX
[See Disclaimer]
** Vanguard's Global Capital Cycles Fund maintains 25%+ in precious metal equities the remainder are companies they believe will perform well during times of world wide stress or economic declines.  

 This blog site is not a registered financial advisor, broker or securities dealer and The Dividend Yield Investor is not responsible for what you do with your money.
This site strives for the highest standards of accuracy; however ERRORS AND OMISSIONS ARE ACCEPTED!
The Dividend Yield Investor is a blog site for entertainment and educational purposes ONLY.
The Dividend Yield Investor shall not be held liable for any loss and/or damages from the information herein.
Use this site at your own risk.

PAST PERFORMANCE IS NO GUARANTEE OF FUTURE RESULTS.

DYI:  Despite all of the fireworks this decline based on valuations is nothing to write home about all shown below by DYI’s stock/bond allocation formula with a miserly 5% in stocks.  Valuations even after this decline remains absurdly high thus future returns remain subpar!  So hold onto your hats and bonds better values are ahead!  
%
Stock & Bonds
Allocation Formula
3-1-20
Updated Monthly

% Allocation = 100 – [100 x (Current PE10 – Avg. PE10 / 4)  /  (Avg.PE10 x 2 – Avg. PE10 / 2)]


% Stock Allocation    5% (rounded)
% Bond Allocation  95% (rounded) 

Logic behind this approach:
--As the stock market becomes more expensive, a conservative investor's stock allocation should go down. The rationale recognizes the reduced expected future returns for stocks, and the increasing risk. 
--The formula acknowledges the increased likelihood of the market falling from current levels based on historical valuation levels and regression to the mean, rather than from volatility. Many agree this is the key to value investing.  
Please note there is controversy regarding the divisor (Avg. PE10).  The average since 1881 as reported by Multpl.com is 16.70.  However, Larry Swedroe and others believe that using a revised Shiller P/E mean of 19.6 , the number since 1960 ( a 53-year period), reflects more modern accounting procedures.


DYI adheres to the long view where over time the legacy (prior 1959) values will be absorbed into the average.  Also it can be said with just as much vigor the last 25 years corporate America has been noted for accounting irregularities.  So....If you use the higher or lower number, or average them, you'll be within the guide posts of value.

Please note:  I changed the formula when the Shiller PE10 is trading at it's mean stocks and bonds will be at 50% - 50% representing Ben Graham's Defensive investor starting point; only deviating from that norm as valuations rise or fall.        
  
DYI


This blog site is not a registered financial advisor, broker or securities dealer and The Dividend Yield Investor is not responsible for what you do with your money.
This site strives for the highest standards of accuracy; however ERRORS AND OMISSIONS ARE ACCEPTED!
The Dividend Yield Investor is a blog site for entertainment and educational purposes ONLY.
The Dividend Yield Investor shall not be held liable for any loss and/or damages from the information herein.
Use this site at your own risk.

PAST PERFORMANCE IS NO GUARANTEE OF FUTURE RESULTS.

The Formula.
DYI:  It is now safe for dollar cost averaging into common stocks; however it is NOT safe to move your bond portion into equities.  That would be a lump sum unless you’ve just started your investment program and the amount is small.  Be as that may be there will be more fire works to come – up or down.

Margin of Safety!

Central Concept of Investment for the purchase of Common Stocks.
"The danger to investors lies in concentrating their purchases in the upper levels of the market..."

Stocks compared to bonds:
Earnings Yield Coverage Ratio - [EYC Ratio]

EYC Ratio = 1/PE10 x 100 x 1.1 / Bond Rate

1.75 plus: Safe for large lump sums & DCA

1.30 plus: Safe for DCA

1.29 or less: Mid-Point - Hold stocks and purchase bonds.

1.00 or less: Sell stocks - Purchase Bonds

Current EYC Ratio: 1.49(rounded)
As of  3-1-20
Updated Monthly

PE10 as report by Multpl.com
DCA is Dollar Cost Averaging.
Lump Sum any amount greater than yearly salary.

PE10  ..........28.05
Bond Rate...2.64%

Over a ten-year period the typical excess of stock earnings power over bond interest may aggregate 4/3 of the price paid. This figure is sufficient to provide a very real margin of safety--which, under favorable conditions, will prevent or minimize a loss......If the purchases are made at the average level of the market over a span of years, the prices paid should carry with them assurance of an adequate margin of safety.  The danger to investors lies in concentrating their purchases in the upper levels of the market.....

Common Sense Investing:
The Papers of Benjamin Graham
Benjamin Graham

Wednesday, February 26, 2020

The
Bubble

Make Good Choices!

John P. Hussman, Ph.D.
President, Hussman Investment Trust
There are two key drivers of investment returns. One is valuations, which provide a great deal of information about long-term investment prospects, and about the income component of total returns. 
The other is the uniformity or divergence of prices across thousands of individual securities, which helps to distinguish whether shorter-term investor psychology is inclined toward speculation or risk-aversion. 
Our disciplined approach to full-cycle investing is driven primarily by those two considerations, because together, they capture the central elements that define capital gains, income, and total return.
DYI:  DYI anticipates long term returns based upon valuations.  Determining short term aberrations for speculative gains I’ll leave to others – who may or may not be successful.
The menu of passive investment choices is now the worst in history 
When market valuations are reasonable or depressed, investors can expect that their willingness to take risk will be compensated by a satisfactory “risk premium” over the long-term. Conversely, when market valuations are elevated or extreme, investors put themselves in a position where the long-term compensation for taking risk becomes very thin.
DYI:  Spot on Professor Hussman!  Common sense but never followed; obviously or we would not have the great rises and falls in markets.  These insane valuations are not just thin they will now produce market losses for the passive investor for stocks held or purchase today over the next 10 years.

Our estimate of prospective 12-year total returns on a conventional passive investment portfolio (invested 60% in the S&P 500, 30% in Treasury bonds, and 10% in Treasury bills) fell below zero for the first time in history.  
The recent low of -0.16% even lower than the level of 0.34% reached at the market extreme of August 1929.
 Image result for hussman chart 60% stocks 30% bonds 10% t-bills pictures
12 year annual nominal total return 
is now below zero - [ -0.16%]
DYI:  Valuations have relentlessly marched higher since 2012 surpassing 1907 and 1966 top while continuing this runaway train blowing past the 1929 high in 2018!  When dshort.com updates their chart in early March it will be interesting to see if the Great Insanity Year of 2000 will be tied or defeated.
Be as that may be this is a terrible time to purchase stocks [or long term bonds as well] for the long haul.  Unless relatives are purchasing stocks for you as you’re drinking out of a sippy cup watching Barney thus having a 50 year plus holding time you will do fine.  However at 45 years of age or more attempting to put it all together for retirement returns will be lousy.  So bad the returns the difference between eating New York Strip steaks or ground chuck!  
Updated Monthly

AGGRESSIVE PORTFOLIO - ACTIVE ALLOCATION - 2/1/20

Active Allocation Bands (excluding cash) 0% to 50%
50% - Cash -Short Term Bond Index - VBIRX
50% -Gold- Global Capital Cycles Fund - VGPMX **
 0% -Lt. Bonds- Long Term Bond Index - VBLTX
 0% -Stocks- Total Stock Market Index - VTSAX
[See Disclaimer]
** Vanguard's Global Capital Cycles Fund maintains 25%+ in precious metal equities the remainder are companies they believe will perform well during times of world wide stress or economic declines.  

 This blog site is not a registered financial advisor, broker or securities dealer and The Dividend Yield Investor is not responsible for what you do with your money.
This site strives for the highest standards of accuracy; however ERRORS AND OMISSIONS ARE ACCEPTED!
The Dividend Yield Investor is a blog site for entertainment and educational purposes ONLY.
The Dividend Yield Investor shall not be held liable for any loss and/or damages from the information herein.
Use this site at your own risk.

PAST PERFORMANCE IS NO GUARANTEE OF FUTURE RESULTS.
DYI

Thursday, February 20, 2020

Blast
From the Past!
Image result for caricatures of al gore pictures


By Jonathan Amos
Science reporter, BBC News, San Francisco


Their latest modelling studies indicate northern polar waters could be ice-free in summers within just 5-6 years.

Former US Vice President Al Gore cited Professor Maslowski's analysis on Monday in his acceptance speech at the Nobel Peace Prize ceremony in Oslo.

What causes climate change? 
Two factors:

1.) Sunspot activity.  Greater the activity and intensity higher sunlight temperature and conversely less intensity and activity lower sunlight temperature.

2.)  Volcanic activity.  Less activity less volcanic material blocking the sun higher the temperature of the earth [depending on sunspot activity] OR increase volcanic activity thus increasing blocking of the sun thus lowering the earth temperature [again depending on sunspot activity].

Al Gore please just go away and stop raiding the treasuries of countries who fall for this bull crap.  Unless you know how to control sunspots or volcanoes – please shut the hell up!

Oh and by the way the Arctic is NOT ice free during the summer months.  

How’s that for an inconvenienced truth!
DYI

Wednesday, February 19, 2020

Bubble
Popping News?
Image result for japan enter fourth recession since 2010 chart pictures

Shades of Detroit? Germany's auto heartlands in peril as 'golden age' fades

Some think-tanks and government officials fear that the toll will be higher as electric cars provide less assembly work than combustion engine vehicles, simple work steps are replaced by automation and companies relocate production.

GM Better Figure Out How to Stop Shrinking, I Mean Globally & Pronto, Before It’s Too Late

GM announced this weekend that it would pull out of Australia, New Zealand, and Thailand, in line with its strategy to exit one market after another to shrink itself to higher profits, which has led to a stupendous downward spiral in vehicle sales.
Image result for gm vehicles global sales plunge wolfstreet
According to some market analysts, the new highs in gold against two major currencies is a further sign of gold's growing investment appeal as a safe-haven asset.
As a non-yielding asset, gold's opportunity costs look attractive as the Germany 10-year yield currently trades around minus 40 basis points. Meanwhile, Japan's 10-year bond offers a negative yield of three basis points.
"Currency debasement is typically a primary force for advancing the price of the benchmark store of value, but it's less about the price of gold advancing and more likely reflects the value of paper currency in decline," he said in a report Friday.
However, McGlone said that it could be only a matter of time before the U.S. dollar takes a hit. Although the U.S. dollar has shown impressive strength so far in 2020, it has not shaken bullish sentiment in the gold market. Gold has held critical support around $1,550 in the face of a stronger U.S. dollar.

Gold is not just resilient against the U.S. dollar; 
it is also holding up despite record valuation in U.S. equity markets
Image result for diversification: s&p500 index v. gold$/oz chart pictures

DYI Quick Comment:  Stocks may continue to rise in the short term however for the long term they will decline due to excessive valuations with gold soaring to new heights.  The Dow to Gold Ratio is now 18 to 1; gold and silver along with their respective mining companies are good value. 
 Updated Monthly

AGGRESSIVE PORTFOLIO - ACTIVE ALLOCATION - 2/1/20

Active Allocation Bands (excluding cash) 0% to 50%
50% - Cash -Short Term Bond Index - VBIRX
50% -Gold- Global Capital Cycles Fund - VGPMX **
 0% -Lt. Bonds- Long Term Bond Index - VBLTX
 0% -Stocks- Total Stock Market Index - VTSAX
[See Disclaimer]
** Vanguard's Global Capital Cycles Fund maintains 25%+ in precious metal equities the remainder are companies they believe will perform well during times of world wide stress or economic declines.  

 This blog site is not a registered financial advisor, broker or securities dealer and The Dividend Yield Investor is not responsible for what you do with your money.
This site strives for the highest standards of accuracy; however ERRORS AND OMISSIONS ARE ACCEPTED!
The Dividend Yield Investor is a blog site for entertainment and educational purposes ONLY.
The Dividend Yield Investor shall not be held liable for any loss and/or damages from the information herein.
Use this site at your own risk.

PAST PERFORMANCE IS NO GUARANTEE OF FUTURE RESULTS.
DYI

Saturday, February 15, 2020


The
The real measure of inflation

THE REAL COST OF LIVING INCREASE INDEX

It exposes why middle-class Americans — salaried workers who are given routine pay hikes and retirees who depend on annual increases in their corporate pension and Social Security payments — can’t maintain their standard of living. Plainly and simply, the Index shows that their income can’t keep up with their expenses, and it explains why they increasingly have to turn to the government for entitlements to bail them out.
It’s because salary and benefit increases are pegged to the Consumer Price Index (CPI), which for more than a century has purported to reflect the fluctuation in prices for a typical “basket of goods” in American cities — but which actually hasn’t done that for more than 30 years.
The inaccuracy of the CPI began in 1983, during a time of rampant inflation, when the U.S. Bureau of Labor Statistics began to cook the books on its calculation in order to curb the increase in Social Security and federal pension payments.
But the change affected more than entitlements. Because increases in corporate salaries and retirement benefits have traditionally been tied to the CPI, the change affected everything. And now, 30 years later, everyone knows the long-term results. Ask anyone who relies on a salary or Social Security or a pension and he’ll tell you his annual increase in income doesn’t come close to his increase in expenses. What comes in is less than what goes out — a situation that spells disaster for average Americans.
Butowsky began calculating the Chapwood Index in 2008. Using social media, he surveyed his friends across the country to determine what they bought with their after-tax income. He narrowed the list down to the most frequent 500 items and asked his friends in America’s 50 largest cities to check the prices on those items periodically. The Index shows the fluctuation in each city in the cost of items such as:
Starbucks coffee, Advil, insurance, gasoline, sales and income taxes, tolls, fast food restaurants, toothpaste, oil changes, car washes, pizza, cable TV and Internet service, cellphone service, dry cleaning, movie tickets, cosmetics, gym memberships, home repairs, piano lessons, laundry detergent, light bulbs, school supplies, parking meters, pet food, underwear and People magazine.
Click here to see the complete list of the Chapwood Index 500 items.
DYI:
Surprisingly the Chapwood index does not average all 50 cities to provide one national number.  Even though that number will be a bit flawed it would certainly be significantly closer to the truth than – let’s cook the books – CPI numbers!  I’m a bit lazy and had no desire to add up all 50 cities to provide the average I did the next best thing.  Oakland California is the highest over the past 5 year average with a 13.1% inflation rate AND Mesa New Mexico the lowest, again a 5 year average inflation of 6.6%.  So – drum roll please – U.S. average inflationary rate 9.85%.  Our wonderful boys and girls at the Bureau of Labor of Lies and Statistic with their February 13, 2020 release – [before seasonal adjustment, of course] the number is: 2.5%!  
Image result for man spitting coffee pictures
Hopefully you didn’t spit coffee all over your laptop computer! 
Only a mere 294% difference or almost 4 times higher!  You and your families have to peddle the economic bicycle 4 times faster just to maintain your standard of living.  This is the reason many end up deeply in debt to maintain or grow their standard of living at least in the short term before the debt binge crashes on top of their heads!
Till Next Time
DYI

Thursday, February 13, 2020

"These are not a cases of Civil Forfeiture they are cases of outright theft Via criminals wearing suits (ie DA) and government issued costumes (ie police) aided/abetted by kangaroo courts staffed by court jesters (ie judges) who have completely forsworn their oaths of office in the name of expediency and profit."
Welcome to the land of the free and home of the brave.
Immoral
Laws

Michigan County Sued For Stealing Cars 

From Innocent 

Car Owners Via Civil Forfeiture

From the someone-did-some-crime-somewhere-maybe-so-we're-taking-your-stuff dept

A 1996 decision by the Michigan Supreme Court set the precedent for the widespread abuse of civil asset forfeiture in the state. The ruling said being an innocent owner of property seized is no defense and any forfeiture predicated on the illegal acts of others could result in the actual owner being deprived of property without violating their Constitutional rights.
A proposed class action has been filed challenging the city's forfeiture program which deprives the owners of their property due to other people's actions. The lawsuit [PDF], filed with the assistance of the Institute for Justice, tells just two of these 2,600 stories. 
Both involve vehicle owners losing their cars because of someone else's alleged criminal acts -- even when no criminal charges were ever filed.
Melisa Ingram, a plaintiff in the lawsuit, knows the many abuses of Detroit’s system firsthand. Last summer her car was seized by Wayne County sheriff’s deputies after she lent it to her then-boyfriend so he could drive to a friend’s barbeque. Later that day, police pulled him over for slowing down in an area known for prostitution. 
Although he was never charged with a crime, police nevertheless seized Melisa’s 2017 Ford Fusion.
Ingram paid $1,355 to get her car back. Six months later, she again loaned the vehicle to her boyfriend while she attended a barbecue. 
As he was pulling away from the house, the same Wayne County deputies pulled him over and seized the car again, claiming the house he was leaving was supposedly connected to drugs or prostitution.
Just like the previous incident, the car was seized immediately
 and no criminal charges were filed.
 Ingram could not afford the $1,800 the police said she had to pay to release her car.
In July 2019, a man with whom Robert [Reeves] sometimes works asked him to visit a job site where he was clearing rubbish. The man had a skid-steer loader at the site and wanted to know if Robert knew how to operate it. Robert demonstrated how to use the equipment and the two men planned to meet the next day to begin their work.
Robert then drove to a nearby gas station and went inside to purchase a bottle of water. As he was leaving, officers surrounded him and demanded to know what he knew about a skid steer that was allegedly stolen from Home Depot. Robert knew nothing other than that the other man had rental paperwork from Home Depot, which was consistent with Robert’s understanding that the equipment had been rented. 
After several hours of detention in the back of a police car, Robert was let go without being arrested.
 He has not been charged with anything.
Police seized Robert’s Camaro on the spot, along with two cell phones and $2,280 that he had in his pocket.
These experiences aren't unique. They can't be. A single county doesn't seize more than 3 cars a day if it's not profitable. But unless the law is changed -- or state precedent overturned -- police will continue to take property from innocent owners because being innocent isn't enough to prevent a forfeiture. That's what the plaintiffs are hoping to change. The lawsuit seeks a ruling declaring the state's forfeiture policies unconstitutional -- a violation of the Fourth, Eighth, and Fourteenth Amendments. It's an uphill fight, given state court precedent.
Federal challenge may finally upend the terrible laws that ruin state residents' lives and deprive them of their property without any finding of criminal wrongdoing.
DYI: 
Make no mistake their district attorney [and supportive staff] plus the different law enforcement personnel know exactly what is going on.  These laws have the spin off effect of corrupting all those involved in other areas as well.  Creating a backdrop of almost anything goes of immoral behavior by the people who are required to serve and protect. 

Las Cruces N.M. is an example where the police were attempting to push the seizure laws to acquire homes [obviously at zero cost] then rent them out to build a separate slush fund for the cops.  Luckily when a new mayor was elected he wanted it stopped but the cops pushed back.  This mayor fired all of the cops plus the DA and much of the supportive staff.  At least that had a happy ending.  Unfortunately most are all in taking full advantage of these immoral laws making this the land of the less and less free.
DYI
"These are not a cases of Civil Forfeiture they are cases of outright theft Via criminals wearing suits (ie DA) and government issued costumes (ie police) aided/abetted by kangaroo courts staffed by court jesters (ie judges) who have completely forsworn their oaths of office in the name of expediency and profit."
Welcome to the land of the free and home of the brave.

Friday, February 7, 2020

Bubble
Trouble

Inflation Adjusted Crude Oil Price Chart
As of 2/7/20
$50.37
Copper has spoken. Its voice is the loudest of the commodities, and it’s not optimistic for the global economy. 
By Monday, copper had seen a 12% drop in price. 
What Does Copper Have To Do With Oil? 
Because it’s tied so closely to manufacturing, industrial production, construction, engineering, and--most recently--information technology, not to mention a host of other sectors, copper is pretty much the best indicator of global economic strength and global demand. 
It’s not a 1:1 correlation, though, and it’s changed quite a bit over the past decade and a half, and particularly since the U.S. shale boom and gains made in the renewable energy sector.
Image result for copper and crude oil correlation
Oil
As of 2/7/20
$50.37

Copper
As of 2/7/20
$1.99
But the fact remains, the connection is incredibly strong, and sustaining: 
LONDON, Feb 3 (Reuters) - Poland became the first emerging market country to sell a mainstream government bond with a sub-zero interest rate on Monday, marking another major milestone in the post-crisis plunge in global borrowing costs. 
Eastern Europe’s biggest economy sold a 1.5 billion euro, five-year bond which once pricing was finalised gave buyers a yield of negative -0.102%. 
Many of Poland’s existing bonds trade at negative yields in secondary markets thanks to the neighbouring euro zone’s deeply sub-zero rates, but to date no mainstream emerging market government bond has been sold with one.

DYI: 
Copper prices are dropping; oil prices declining; Eastern European countries debt gone negative all signs of an ailing world economy.  When you are on top of the mountain you will go down no matter which way you go and so it goes for the U.S. economy as well.  I only envision a mild downturn economically the U.S. doesn’t have the massive imbalances that occurred during the run up of 2009.  Of course the U.S. stock market is terrifyingly overpriced housing commercial or residential and oil/gas prices are far more subdued thus the making of a more tolerable downturn.

Old style pensions [defined benefit] all will slash benefits.  Unfortunately politicians have over promised – thus garnering votes from government employees – underfunded and with sub atomic low interest rates for their bond holdings these pensions will have reductions in benefits that will continue for at least another decade.  A 50% decline plus [DYI anticipates 65% to 80% multi cycle decline] in stock values for pension equity positions a federal bailout is a high possibility.   
DYI

Monday, February 3, 2020

Secular Top
Investment Report
[Let’s Party its 1929!] 

Image result for shiller pe chart pictures
As of 2/3/20
30.84

From High to Low - Since Year 2000

+446.6% Gold
+254.9% Transports
+231.1% Utilities
+145.8% Dow
+124.9% Nasdaq
+119.5S&P 500
+101.4% Oil 
+  69.0% 30yr Treasury Bonds
+  64.0% Swiss Franc's

December 1999 Shiller PE10 was 44.19               
August 2000 S&P 500 dividend yield was 1.11% 


DYI:
The Federal Reserve has once again turned on the money supply pumping up to market to new highs.  Since the secular top in the year 2000 the NASDAQ has moved up two notches outperforming the S&P 500.  Interest sensitive stocks moved up in performance from last month [didn’t change places in the overall performance derby] especially utilities with a nice pop to the upside highlighting the fact that the Fed’s want to keep on partying like its 1929! 
    
This Will Not End Well

For those holding or purchasing stocks today going to sleep like Rip Van Winkle waking 10 years from now will expect an estimated average annual return of – drum roll please - +0.13!  Yep that’s it for all of your toil and troubles as a buy and hold type of guy or gal!

Let’s not confuse dollar cost averaging as that return will be an average return over many years.  Dollar cost averaging [DCA] is nothing less than cleverly disguised small lump sums generally twice monthly for those with 401k type plans.  Depending upon the valuation level of the market and the size of the deposit at that time will determine your overall averaged return. 

When the 401k provider arrive entertaining you their dog and pony show they will always say it’s not timing the market [DYI are not speculators] but time in the market.  Back to Money Chimp and now plug in 20 years – drum roll please – 3.41%!  Wow a 2,523% increase in rate of return!  That is based on a relative basis between those two numbers however on an absolute basis a 3.41% return will only have you eating Alpo dog food in retirement!  So yes longer the time in the stock market greater your return.

Of course how long is the question? 

Just for fun going out 40 years – drum roll please – 5.09% an increase of 49%.  That’s an improvement moving your retirement years from having to eat Alpo dog food to chuck roast.  This is also an example of the law of diminishing returns when you go out 80 years [5.94%] the relative increase is now only 17%.  160 years??  Average annual return 6.37% or a relative increase from 80 years holding to 160 years of 7%!  So yes time in the market increases performance but relative to what and how long is always the question.

Active Asset Allocation

Four Uncorrelated Assets
1.)  Stocks
2.)  Long Term High Grade Corporate/Government Bonds
3.)  Short Term Notes (Cash)
4.)  Gold – Precious Metals Mining Companies

Four Assets Correlated to Four Economic Conditions
1.)  Prosperity
2.)  Deflation
3.)  Recession

4.)  Inflation

1.)  Prosperity: Stocks become a clear winner during conditions of increasing employment, rising wages tied to increasing productivity along with rising profits.  Junk bonds (they trade like stocks) are also winners in this environment despite their low quality; the economy is so good interest and principal payments are made – defaults are minimum – and a positive climate for refinancing.  High quality corporate/ government bonds are secondary winners as prosperity is noted for stable or slowly declining rates.  Gold is generally a loser in prosperity as inflation is minimized and investors seek higher returns in more traditional investments.


2.)  Deflation:  Deflation is the decease in the general price level of goods and services.  The Great Depression is a standout example of deflation.  The general cause is when excess debt is built up in the private sector that can no longer be increased and/or maintained resulting in massive bankruptcies.  This creates an environment of panic as businesses scramble to become profitable by firing employees and cutting hours of remaining workers.  In this deflationary episode interest rates decline, prices decline, and the almighty buck rises in value against softer currencies.

Long term high quality corporate bonds and long term U.S. government bonds are winners in this type of economy.  Stocks, gold, and junk bonds generally will fall in price along with interest rates on short term notes.

3.)  Recession:  For DYI's purposes recessions are a period of increasing interest rates engineered by the Federal Reserve in order to quell inflation by slowing down an over heating economy.  This condition is temporary as the economy will either adjust to the new economic environment bringing back prosperity or a deflationary period will begin.

High quality corporate/government bonds, stocks, gold, and junk bonds are all losers in this scenario. Short term notes and money market funds are clear winner as their principal value remains steady plus the interest income improves with increasing interest rates.

4.)  Inflation:  Too much money chasing too few goods.  When Federal government liabilities become onerous from financing of war(s) and/or social programs that are too great to be paid by taxation governments will resort to money creation to pay the remaining costs.  After WWII, Korea, Vietnam and the war on Poverty inflation began slowly prices increased relentlessly (despite high taxes) as government liabilities expanded.  When President Richard Nixon closed the gold window (1971) the last vestige of inflationary controls were removed with inflation peaking in the high teens only until Paul Volker was appointed as Fed Chairman (August 79) who crushed inflation with high interest rates.

Stocks, high quality long term corporate/government bonds, junk bonds are all losers as inflation soars along with interest rate increases (despite the Fed's efforts to suppress them).  Cash (money market funds) or short term notes are neutral or slightly lag inflation rolling up to the higher interest rate quickly.

Gold is a winner when inflation breaks above 5%.  When inflation goes double digit gold is marked up in price to reflect the debasement of the currency.  Gold will also rise in price based upon fear of massive defaults as gold has no counter party risk.

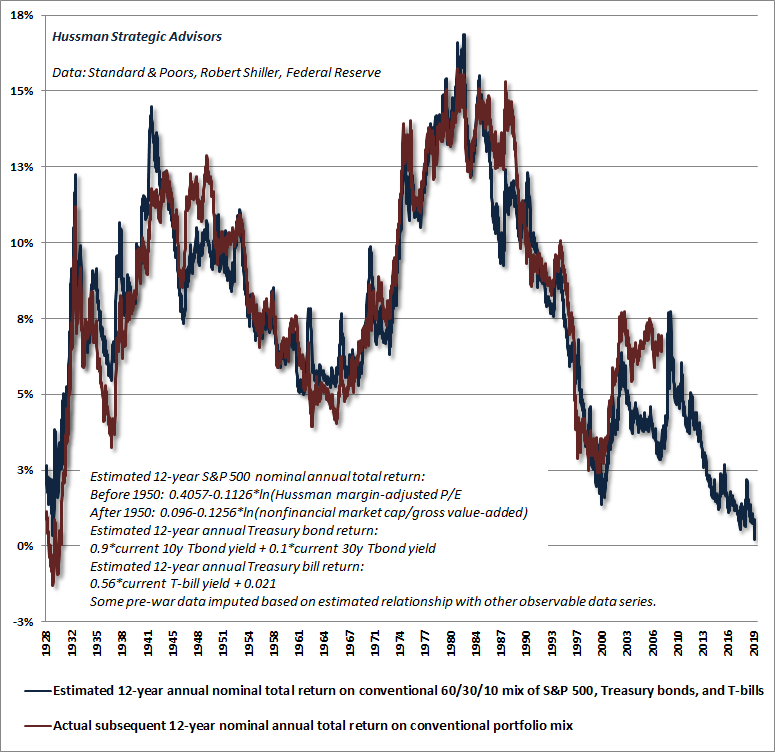
 VALUATIONS DO MATTER

This investment approach is an offshoot of Harry Browne's Permanent Portfolio that maintains a fixed 25% invested in the above four asset categories listed above.  Harry's uncorrelated assets at that time was ground breaking.  Today it is taken for granted.  As much as I was impressed with Harry's work it always made me uncomfortable to always own 25% in each asset. When valuations are at extreme lows a greater percentage is called for and conversely at historical nose bleed levels significantly less (or none).

DYI’s approach working through our four assets and determining with a measure of accuracy the percentage invested depending upon long term valuations.  This is done by calculating our averaging formula for each asset.

If all three assets - gold, stocks, long term bonds, cash is our default position - are at fair or average value then each of the categories will be at 25% of the portfolio just like Browne's Permanent Portfolio.  However as prices move up or down from their respective mean our averaging portfolio will make the adjustment enhancing the overall return. 

Will DYI outperform the market??

Our primary goal is to outperform the Permanent Portfolio first.  Outperform the market?  Maybe? DYI's intentions is a 6% real return - as opposed to Browne's 4% - into your pocket with low volatility as opposed to our fully invested stock market investor.  In closing each of these assets stocks, long term bonds, gold and cash, all have their moment of fame or shame.  Value players reduce or eliminate the overvalued assets and increase the undervalued; simple as that!  

 Updated Monthly

AGGRESSIVE PORTFOLIO - ACTIVE ALLOCATION - 2/1/20

Active Allocation Bands (excluding cash) 0% to 50%
50% - Cash -Short Term Bond Index - VBIRX
50% -Gold- Global Capital Cycles Fund - VGPMX **
 0% -Lt. Bonds- Long Term Bond Index - VBLTX
 0% -Stocks- Total Stock Market Index - VTSAX
[See Disclaimer]
** Vanguard's Global Capital Cycles Fund maintains 25%+ in precious metal equities the remainder are companies they believe will perform well during times of world wide stress or economic declines.  

 This blog site is not a registered financial advisor, broker or securities dealer and The Dividend Yield Investor is not responsible for what you do with your money.
This site strives for the highest standards of accuracy; however ERRORS AND OMISSIONS ARE ACCEPTED!
The Dividend Yield Investor is a blog site for entertainment and educational purposes ONLY.
The Dividend Yield Investor shall not be held liable for any loss and/or damages from the information herein.
Use this site at your own risk.

PAST PERFORMANCE IS NO GUARANTEE OF FUTURE RESULTS.
   DYI