Saturday, September 21, 2019


Image result for oil wells pictures
We need to keep our heads clear on what is happening to the economy. Although pundits propose various ills to explain the daily assault on our livelihoods, at the end of the day it's energy that underpins everything. A look at the situation finds two factors that are dragging the industrial economy into a morass from which escape is likely impossible. 
First, the net energy provided by fossil fuels, oil in particular, is gradually falling, which means that the surplus energy left over to run the economy gradually declines. 
Second, the proportion of energy from renewable sources is rising, which means that an increasing amount of dilute, low-quality energy is being fed into the system. 
This aggravates the problem by creating a further drag on the economy. Unless some new, inexpensive, high-quality, and high-density form of energy is found soon, we are in some deep doo-doo. -- RF
DYI: 
Rice Farmer is completely correct.  However over the shorter run I envision oil and gas prices dropping to reflect an upcoming recession with oil prices possibly lower than $30 a barrel for a mild downturn that I expect to occur.  If things get ugly – a far less possibility – oil could drop below $20.  If that were to happen then this blogger would be wildly bullish for the oil and gas industry.  So…Hold onto your hats; over the next few months things are going to get very interesting especially for value players!
Image result for inflation data 2018 long term oil chart pictures
As of 9/21/19
$58.09
DYI

Wednesday, September 18, 2019

The

Great Melt!
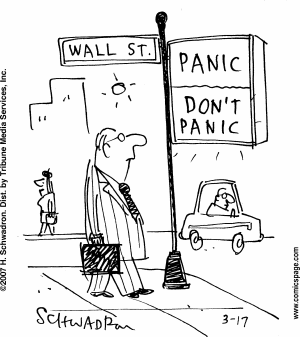
The Best Time to Panic?
Before Everyone Else!
Kenneth E. Royer
Dividend Yield Investor

Image result for financial panic pictures

David Stockman on the Coming Financial Panic and the 2020 Election

David Stockman: It’s very difficult to know. It is not inconceivable that the Fed and other central banks could pull a couple more rabbits out of their hats. 
Also, Trump could take the trade war to the edge and then pull back like he constantly does. He flinches constantly. He could do so again if he sees the market moving lower too fast. But if you look at the charts, there are massive air pockets down below, let’s say, the 2700, 2800 level on the S&P 500. 
If there’s an event—like some tankers blow up in the Persian Gulf or something really bad happens in the Taiwan Straits or the Chinese pull some real retaliatory stunt like dumping a couple billion bonds in one hour—it could tank the market. 
And remember 80% of daily volume in the stock market is essentially either index-driven ETFs or various kinds of quantitative, machine-driven investment strategies. If that ever breaks loose, the market will go through an air pocket, and then it’s all over except for the shouting. 
Because if the S&P 500 drops 400, 500, 600 points, you will trigger another go-round in the corporate C-suites. They’ll suddenly wake up like they did in October 2008 and say, “Oh my God, we’ve got too much inventory, we’ve horded too much labor, we’ve got a lot of assets that aren’t producing returns.” And then they go into these big restructuring programs where they lay off workers by the tens of thousands and take huge write-downs, close facilities, and so forth. The next thing you know, you have a C-suite–triggered recession. That’s how it happens these days. 
Recessions don’t happen because the Fed is tightening credit costs for Main Street. That’s the old days. That’s your grandfather’s economy and your grandfather’s Fed. 
But we’re now in the era of bubble finance. 
The Fed basically inflates the financial system until it collapses, and then it spills over into the mainstream economy through corporate panics. 
If the stock market cuts through these air pockets down below, the recession will happen instantly, and no one will see it coming—just like in 2008. 
I remember in the spring of 2008 they were still talking about the Goldilocks economy. And in November 2008, they were talking about the end of the world. 
This is exactly what I think will happen if the stock market breaks loose. 
We don’t know when it will happen. It could happen before November 2020 or after it. No one can really predict. 
I think the odds are that it will happen before then, and if it does, Trump is toast. Elizabeth Warren will be the next president of the United States, and as that prospect becomes even more probable, the panic in the stock market will be something to behold. It will be worse than anything we’ve seen since October 1987. 
If you talk about volatility, you haven’t seen nothing yet. Wait until the election gets really in full heat next year. 
I think Elizabeth Warren will come to the top. Joe Biden is quasi senile, and he’s going to fall by the wayside. Bernie just isn’t going to cut it with the mainstream Democrats. So, Warren is going to pull ahead. 
And if the stock market is faltering or it has crashed and the economy’s in trouble, you’ll have a populist, redistributionist, big government statist president and Congress. 
That’s a totally different world from this dance fantasy that we’ve been living for the last 10 or 15 years. 
Stockman Continues.... 
So, at the very worst time in the business cycle, Trump is massively increasing the structural deficit. 
When I say the very worst time, it is both in calendar time and in cycle time. Because in calendar time, we’re entering the 2020s when all 80 million baby boomers are going to retire. 
We’re going to be having 10–11,000 retirements a day for most of the decade. And by the end of the decade, there will be 80 million more people on Social Security, Medicare, and Medicaid. 
The cost of the welfare state is going to soar even as the political environment will become totally nonfunctional, because no one wants to pay more taxes. 
The military-industrial complex is running with a trillion-dollar budget. There’s just no give anywhere, not on taxes, not on defense spending, not on entitlements, not on the entire welfare state. 
So, the fiscal situation is going to completely unravel in the decade ahead.The real debt of the country today is not the $22 trillion that’s on the books. That’s backward looking. It’s really $42 trillion. That’s because we have $20 trillion more baked into the cake under almost any scenario you can look at over the next decade, based on these factors I’ve just enumerated. 
Now, $42 trillion of debt on a GDP that might get to be, in nominal terms, $27, $28 trillion by then (but probably less), that’s a 150% debt-to-GDP ratio. I just don’t see how you get out of that box. 
We’re in a demographic and fiscal dead end. It’s a very dangerous prospect and one with no obvious answer on how to escape.


Points of ‘secular’ undervaluation such as 1922, 1932, 1949, 1974 and 1982 typically occurred about 50% below historical mean valuations, and were associated with subsequent 10-year nominal total returns approaching 20% annually. By contrast, valuations similar to 1929, 1965 and 2000 were followed by weak or negative total returns over the following decade. That’s the range where we find ourselves today. Of course, we also won’t be surprised if the S&P 500 ends up posting weak or negative total returns in the 2007-2017 decade, which would require nothing but a run-of-the-mill bear market over the next couple of years. - John Hussman


Image result for dow gold ratio chart pictures
The Dow/Gold Ratio chart shows the ratio of the price of the Dow to the price of gold. Another way to look at it is the number of ounces of gold it takes to buy one share of the Dow. For example, with the Dow at 10,000 and gold at 500, it requires 20 ounces of gold to buy one share of the Dow, so the ratio is 20. The reason for using gold is that gold is the most unbiased form of money in existence. Fake government paper money comes and goes, but gold has been money for thousands of years. It is the ultimate store of wealth.

The chart shows the cyclical nature of the battle between paper assets and hard assets. Paper assets excel when everyone is fixated on growth. When the growth phase ends, and preservation of wealth becomes the paramount concern, gold tends to excel. When paper burns, gold shines.

The long term trend of the ratio is up at a rate of 1.25% per year. This should be expected as the process of mining gold becomes more efficient and cheaper due to advances in machinery, energy, exploration technology, chemicals, etc. In fact, the advances in mining probably match the efficiency gains seen in the economy in general.

The ratio has stayed within a defined channel except for an over shoot around 1980. An explanation for the over shoot could be that gold was pricing in the possibility of continued high inflation.

The Dow/Gold Ratio chart shows that we witnessed the end of an era for equities. Stocks had an 18 year bull market where buy and hold was the guaranteed way to make money. Unfortunately for the stock market bulls, asset classes go in and out of favor, and gold proved to be the next great asset class. The chart shows that, as predicted, the ratio reached the bottom of a potential channel. Where the ratio goes next is dependent on government policy. Zero interest rates coupled with huge government deficits could send the Dow/Gold ratio far below 5.
Image result for pictures gold silver ratio


Image result for U.S. housing bubble chart pictures


DYI:
Over the next 20 years plus – stocks, residential real estate, long term corporate and to a lessor degree long term government bonds will experience the great melt down for prices.  Boomer’s are now about half way through – [as of 4 days ago including this blogger] – to retirement.  As a group they are desperate for cash and they have been systematically selling since 2008.  The only reason prices are back to the heavens is severe Federal involvement especially the Federal Reserve with their sub atomic low interest rate policy.  When the next recession hits whether caused by standard economic forces or simply asset prices dropping the Feds will pull down rates to the negative level with 3 to 5 year T-notes!

Mr. Market

In the end Mr. Market will have his way as he is far more powerful than any government or Fed chairman.  With 80 million Boomer’s selling off real estate, stocks and bonds, AND with Generation X’er’s and Millennial’s so deeply in debt the only way Boomer’s will find a buyer is with lower and lower prices.  That’s right the best time to panic is before everyone else!     

Updated Monthly

AGGRESSIVE PORTFOLIO - ACTIVE ALLOCATION - 09/1/19

Active Allocation Bands (excluding cash) 0% to 50%
73% - Cash -Short Term Bond Index - VBIRX
27% -Gold- Global Capital Cycles Fund - VGPMX **
 0% -Lt. Bonds- Long Term Bond Index - VBLTX
 0% -Stocks- Total Stock Market Index - VTSAX
[See Disclaimer]
**Tocqueville Gold Fund TGLDX is a pure play 100% junior gold mining gold fund.  Vanguard's Global Capital Cycles Fund maintains 25% in precious metal equities the remainder are companies they believe will perform well during times of world wide stress or economic declines.  

 This blog site is not a registered financial advisor, broker or securities dealer and The Dividend Yield Investor is not responsible for what you do with your money.
This site strives for the highest standards of accuracy; however ERRORS AND OMISSIONS ARE ACCEPTED!
The Dividend Yield Investor is a blog site for entertainment and educational purposes ONLY.
The Dividend Yield Investor shall not be held liable for any loss and/or damages from the information herein.
Use this site at your own risk.

PAST PERFORMANCE IS NO GUARANTEE OF FUTURE RESULTS.
DYI

Saturday, September 14, 2019


Why the US China trade war is happening
China has been making serious progress to becoming a world class economy financially and militarily. Donald Trump appears to recognize this and has launched a Trade War against China. 
Gary Shilling 
explains this dynamic 
in his new post on Bloomberg.


The escalating trade war between the U.S. and China has reached a fever pitch, with financial markets seeming to lurch on every new development no matter how insignificant. That’s understandable, but what investors need to know is that in a world of surplus goods and services, the buyer has the upper hand.

Sure, both sides are under considerable pressure to reach a deal. President Donald Trump faces re-election next year, and the longer the trade disruptions drag on, the bigger the potential for a steep stock market selloff and the deeper the recession I think the U.S. economy has already entered. Xi Jinping, China’s de facto president-for-life, is strapped with a slowing economy, with the 6.2% rate of expansion reported for the second quarter probably double the truth. Also, some Communist party elite fret over Xi’s power and his provoking the U.S. and other countries with aggressive military expansion and the heavy-handed Belt and Road program.

Nevertheless, the basic issue is China’s challenge to the U.S. for global supremacy and the importance of technology in this struggle. China’s growth has depended on Western equipment and cheap local labor to produce inexpensive goods that could be freely exported to North America and Europe. With slower growth in the West and muted demand for everything, including imports, that game is over. So, too, is Chinese growth through infrastructure spending. The result has been excess capacity, ghost cities and a huge increase in debts.

So China must turn to domestic growth, but with the earlier one child-per-couple policy, the labor force will be shrinking for decades. Hence the need for technology-driven productivity. But China is only starting on domestic technology development and therefore desperately needs help from the West. For years it has been demanding the transfer of technology as the price of Western firms doing business in China. Trump seems well aware of China’s long-run game plan and determined to retard it.

Meanwhile, the slide in China’s economy will intensify as Chinese and foreign producers accelerate their shift to even-lower-cost Asian countries that are out of the line of the U.S.-China trade war fire. These include Vietnam, India, Malaysia, Taiwan and Thailand. Already, the direct and indirect effects of the trade spat have dropped China from being America’s largest trading partner to third place behind Mexico and Canada. U.S. bilateral trade with China fell 14% in the first half of 2019.

Declining imports from China have been offset by purchases elsewhere. U.S. imports from Vietnam leaped 33% in the first half. In June, exports to the U.S. from South Korea, Taiwan, Japan and Singapore rose by a combined 9% from a year earlier, using a three-month moving average, while their exports to China fell 9%. Singapore’s shipments to China plunged 23% in May from a year earlier, the fourth drop in five months. Much of those imports are components that China assembles for final export to the West.

But despite Trump’s hopes, manufacturing is not returning to the high-cost U.S. Manufacturing output dropped 1.1% in June from its December peak, and the Institute for Supply Management’s manufacturing index fell again in July, this time to its lowest level since 2016.

Rising costs in China have encouraged manufacturers of apparel, footwear and other low margin consumer items out of China in recent years, but now the departure of electronics and other high margin products are troubling Beijing. And Chinese leaders are aware that once these operations leave and labor is trained and supply chains established elsewhere, they are unlikely to return.

Foxconn, which assembles Apple’s iPhones and iPads, mostly in China, is considering shifting production elsewhere. It has plants in Brazil, Mexico, Japan, Vietnam, Indonesia, the Czech Republic, the U.S., Australia and other countries. Only 25% of its manufacturing is outside China, but Young-Way Liu, the head of Foxconn’s semi-conductor business group, recently said the company’s manufacturing capacity outside China is adequate to supply Apple and other customers with products for the U.S. market, and that production could be expanded at facilities worldwide “according to the needs of our clients.”

Meanwhile, Apple is asking suppliers to consider moving final assembly of some products out of China. This would involve a third of production for some devices, including iPhones, iPads and MacBooks, and destinations under consideration include other Southeast Asian countries. Nintendo is shifting some output of its Switch video game console to Southeast Asia from China. Japan’s Sharp, which is controlled by Foxconn, said in June that it planned to move personal computer production to Taiwan and Vietnam from China.

So, while China suffers from the departure of high margin production, the U.S. will still enjoy low-cost imports from other Asian countries—and emerge from the trade war on top.  But the long-term gain to American consumers that follows the short-term pain of the trade war may be limited by China’s determined challenge for world domination.
DYI

Thursday, September 12, 2019

At this point in time the place to be is in 30 year T-bonds plus gold and silver!

9-9-19
Updated Monthly

Secular Market Top - Since January 2000

+133.1% Dow       
+246.1% Transports 
+199.4% Utilities

+102.2%  S&P 500
+  99.1%  Nasdaq

+68.8%  30yr Treasury Bond

+423.3% Gold
+120.8% Oil
  +59.6% Swiss Franc's
    
From High to Low - Since Year 2000

+423.3% Gold
+246.1% Transports
+199.4% Utilities
+133.1% Dow
+120.8% Oil 
+102.2% S&P 500 
+  99.1% Nasdaq  
+  68.8% 30yr Treasury Bonds
+  59.6% Swiss Franc's

December 1999 Shiller PE10 was 44.19               
August 2000 S&P 500 dividend yield was 1.11%  

Shiller PE10 9-9-19 is 30.07
S&P 500 dividend yield 9-9-19 is 1.87%
[Shiller PE10 & dividend yield is reported using data from the beginning of the month when I update.  It may or may not be exactly the first day.]

It is easily seen in the year 2000 the Nasdaq was horribly overvalued and gold was on the give away table, such lopsided returns 19 years later!

Also of interest the stodgy 30 year Treasury bond since the year 2000 outperformed the Dow, S&P 500 and Nasdaq until the Trump rally.  With valuations stretched to these lofty levels a value player such as DYI will once again place his monies in 30 year T-bonds or long term high quality corporate bonds out performing stocks over the next 10 to 15 years.  Please note due to the Fed's sub atomic low interest rates 30 year T-bonds or high quality long term corporate bonds will highly likely out perform stocks over the next 10 to 15 years with one big caveat; out performance will be losing far less money than stocks! Ouch!          

Wednesday, September 11, 2019

Image result for pictures gold bars

Peter Schiff: China, Russia buying gold because 

'they can read the writing on the wall'

Meanwhile, Russia has more than quadrupled its reserves over the past decade amid its promise to break its reliance on the U.S. dollar. Russia’s central bank has bought 106 tons so far this year, according to Bloomberg. 
Trade war uncertainty and worries about the health of the global economy have helped propel gold prices to their highest level in six years. The precious metal is up almost 18 percent this year and last month hit $1,550 an ounce for the first time since April 2013.

Russia’s gold stash now worth more than $100 billion

[DYI their gold stash is far greater than 100 billion!]
“Russia prefers to cushion its macroeconomic stability through politically neutral tools,” said Vladimir Miklashevsky, a strategist at Danske Bank A/S in Helsinki. “There is a massive substitution of U.S. dollar assets by gold — a strategy which has earned billions of dollars for the Bank of Russia just within several months.” 
Not all of Russia’s moves are paying off. Last year, the central bank shifted about $100 billion of U.S. holdings into euros, yuan and the yen, and since then the Chinese currency has dropped. Russia also missed out on the rally in U.S. Treasuries. 
Russia may keep buying gold to compensate for those other losses in its reserves, said Kirill Tremasov, a former Economics Ministry official and now director of analysis at Loko-Invest in Moscow. So far it’s working, with gold up 18% this year to $1,513 an ounce.

Russia Considers Possibility Of $25 Oil Next Year

Russia’s Central Bank has forecast in its macroeconomic forecast that oil could possibly hit that low due to falling demand for oil and oil products worldwide, as well as from disappointed global economic growth. 
One of the reasons why Russia is more impervious to low oil prices compared to its competition is that its currency weakens when oil prices fall. This provides some type of a cushion—at least to some extent—for its lower oil revenues. Russian oil companies can pay their expenses in this weaker ruble, but still rakes in US dollars for its oil exports. Further allowing it to withstand lower prices, are that Russia’s oil company’s taxes are designed to be less as oil prices fall. 
So much so is Russia’s ability to adapt to lower oil prices, that it actually struggles with higher oil prices, which dent demand for its oil. Russia’s budget for 2019 was based on $40 oil. Meanwhile, Saudi Arabia needs $80—some say even $85—per barrel.
In its calculations, AB Bernstein pulls in debt from a variety of sources and compares it to GDP as follows:
  • 100% of GDP using federal, state and local government debt combined.
  • 150% for households and firms
  • 450% for financial debt, which carries “conceptual issues and risks,” namely that debt held by financial firms often represents potential in a worst-case scenario involving various derivative instruments that can carry high notional levels that are unlikely ever to be realized.
  • 27% in trusts for social insurance programs.
  • 484%, which values all the promises from current social insurance programs.
633%, which tallies up an “infinite horizon” of obligations for social programs, rather than just the traditional 75 years used in computations.

Illinois' Record $47 Billion Loss Ignored By Mainstream Media. Why?

The loss of $47 billion for the state’s 2018 fiscal year, shown in audited financial statements released late last month, is an astonishing number. For some perspective, that’s about $7 billion more than the entire, current annual budget.

Families Go Deep in Debt to Stay Middle Class: Revolving Credit Jumps 11.2%

The American middle class is falling deeper into debt to maintain a middle-class lifestyle. 
Cars, college, houses and medical care have become steadily more costly, but incomes have been largely stagnant for two decades, despite a recent uptick. Filling the gap between earning and spending is an explosion of finance into nearly every corner of the consumer economy. 
Consumer debt, not counting mortgages, has climbed to $4 trillion—higher than it has ever been even after adjusting for inflation. Mortgage debt slid after the financial crisis a decade ago but is rebounding. 
Student debt totaled about $1.5 trillion last year, exceeding all other forms of consumer debt except mortgages. 
Auto debt is up nearly 40% adjusting for inflation in the last decade to $1.3 trillion. And the average loan for new cars is up an inflation-adjusted 11% in a decade, to $32,187, according to an analysis of data from credit-reporting firm Experian.
 DYI: 
The most likely outcome is that the U.S. economy will experience a mild recession and yet despite this slight and insignificant [unless you are laid off!] downturn we should expect the following:
  • Negative interest rates out to 5 years in length for Treasury notes.
  • Oil prices below $30 dollars per barrel
  • Massive budget deficits
  • Huge money printing by the Federal Reserve
  • Defaults in the junk bond market
  • Deflationary smash with inflation going backwards
  • Gold and silver to go up in price as investors seek high quality investments
  • Long term Treasuries fly to the heavens as rates drop significantly.
DYI

Monday, September 9, 2019

Image result for 5 year t-notes chart pictures
As of 9/9/19
1.55%

Here’s What I’m Worried About. 

And It’s Not a Recession

A rout in the hyper-inflated bond market can blow up everything at this point.

Image result for charles hugh smith silver chart pictures
DYI: 
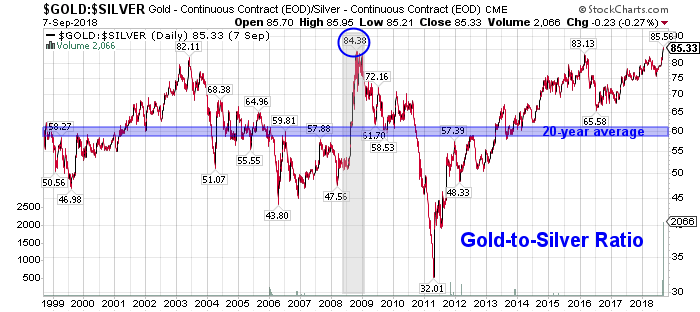
There is no doubt in this bloggers mind that the U.S. during the next recession driven into negative rates.  A mild recession that I’m anticipating will push down [interest rates] T-Bills and T-Notes up to 5 years in length into the negative territory.  This will push up in price significantly precious metals and especially with silver undervalued as compared to gold as noted by the Gold /Silver Ratio.
 Image result for gold/silver ratio chart pictures
As of 9/9/19
84 to 1
I’m hoping that silver will take a tip in price so that I can expand my position.  If precious metals are back in a bull market – as I believe they are – then dips in price will be violent but just long enough in time to chase out the early bird investors.  The value players – those who follow this blog – will use these moments to expand their positions!  
Updated Monthly

AGGRESSIVE PORTFOLIO - ACTIVE ALLOCATION - 09/1/19

Active Allocation Bands (excluding cash) 0% to 50%
73% - Cash -Short Term Bond Index - VBIRX
27% -Gold- Global Capital Cycles Fund - VGPMX **
 0% -Lt. Bonds- Long Term Bond Index - VBLTX
 0% -Stocks- Total Stock Market Index - VTSAX
[See Disclaimer]
**Tocqueville Gold Fund TGLDX is a pure play 100% junior gold mining gold fund.  Vanguard's Global Capital Cycles Fund maintains 25% in precious metal equities the remainder are companies they believe will perform well during times of world wide stress or economic declines.  

 This blog site is not a registered financial advisor, broker or securities dealer and The Dividend Yield Investor is not responsible for what you do with your money.
This site strives for the highest standards of accuracy; however ERRORS AND OMISSIONS ARE ACCEPTED!
The Dividend Yield Investor is a blog site for entertainment and educational purposes ONLY.
The Dividend Yield Investor shall not be held liable for any loss and/or damages from the information herein.
Use this site at your own risk.

PAST PERFORMANCE IS NO GUARANTEE OF FUTURE RESULTS.

Friday, September 6, 2019

Beware (And Prepare): 

American Empire Is Collapsing

When empires fall, they do not go down gracefully. The collapse is sudden and the consequences are permanent. Like the schoolyard bully who is finally defeated, his former victims and enemies revel in his fall. The US empire is now teetering on such a collapse. The signs are all around us. Aggressive US foreign policy, self-destructive monetary policy that debases the currency and hides inflation, a monstrous national and individual debt load. The writing is on the wall and the wise are preparing. What can we do? Tune in to today's Liberty Report:

DYI