Friday, April 29, 2016

Bank of Japan shocks investors with no stimulus, leading to global stock selloff

With Japan's economy in a deep slump, most analysts expected the Bank of Japan (BOJ) to add stimulus to the economy by one form or another of "printing money" -- by increasing its purchase of bonds ("quantitative easing") or by lowering the interest rate, which is already negative, to make it even more negative. 
Instead, the BOJ announced on Thursday that it would not add any new stimulus to the economy at all at the present time. This was a shock to investors, who responded by selling off stocks, causing the Tokyo Stock Exchange Nikkei index to plummet 3.6%. This triggered a world wide selloff on Thursday, though generally not as deep as the Nikkei selloff. 
The Bank of Japan adopted negative interest rates three months ago, in what was considered a move of desperation. ( "30-Jan-16 World View -- Japan tries negative interest rates as US economy slows") But that move has been ineffective in promoting economic growth, so the BOJ may have decided that another stimulus move wouldn't make any difference. Actually, not adding stimulus did make a difference of a kind that wasn't expected. 
Using stimulus over and over to push up the stock market cannot work forever. By the Law of Diminishing Returns, each new injection of stimulus will have a smaller effect that then previous injection. 
What this illustrates is the dependence in today's world of stock markets on central banks. No one serious believes any more that the stock market is meaningfully related to a country's economy. The stock markets today are being held up by the central banks -- by the BOJ in Japan, the European Central Bank, the Bank of England, and the Federal Reserve in America. 
The Fed raised interest rates by 0.25% in December, and that move is widely thought to have harmed the US economy. Today, just about the only stories important to financial media are the debates over whether the Fed is going to raise rates again, or whether it will reverse the December increase. 
As we reported last week, the S&P 500 Price/Earnings ratio has rocket above 24, its highest value in years. Generational Dynamics predicts that the P/E ratio will fall to the 5-6 range or lower, which is where it was as recently as 1982, resulting in a Dow Jones Industrial Average of 3000 or lower.
DYI 

Thursday, April 28, 2016

Semiconductors Signal No Relief in Global Macroeconomic Slowdown

semisapr3
semisapr14

DYI Comment:  How long will this economy continue to dance on the head of a pin between slow growth and recession is anyone's guess.  However, this economy is long in the tooth so any shock good very well dip the scales to recession in a hurry.  With a sky high stock and corporate bond(especially junk) market a massive drop is in the offering.  When?  I don't know and nor does anyone else.  All that is known is the economy has been moving ahead since 2009 and stock/bonds are in bubble land.  This is not the time to throw caution to the wind.
DYI

Wednesday, April 27, 2016

Why a Collapse Is “Practically Unavoidable”

According to George Soros, China’s debt collapse has begun… 
According to Soros, a major crisis in China is “practically unavoidable.” 
• China is the world’s second-largest economy... 
And it’s the world’s largest commodity consumer and exporter. 
China has grown rapidly over the past two decades. It has fueled that growth with obscene amounts of borrowing. Its debt-to-GDP ratio stands at 250%. In other words, China owes 2.5x more than it produces in a year.
DYI Comments:  This could be the moment that China's financial debt bomb explodes. China the worlds 2nd largest economy there certainly will have ripple effects in the world economy.  Japan who are deeply in debt as well and dependent upon exports a world wide recession would decimate their economy.  Europe is a basket case especially Italian banks that are teertering on the precipice.  Where the EU leaders believe that to solve a debt problem is with more debt.  Similar in an attempt to drink yourself sober.
• The U.S. is even more indebted than China… 
The U.S. federal government owes a record $19 trillion. Its debt has more than doubled since 2007. 
Dispatch readers know the U.S. government launched all sorts of extreme measures after the 2007–2009 financial crisis. It borrowed trillions of dollars…created trillions more out of thin air…and cut rates to effectively zero. 
These policies were supposed to stimulate the economy…but the U.S. economy is growing at the slowest pace in decades. 
Casey Research founder Doug Casey says the government’s reckless policies have set us up for a financial catastrophe.
DYI:  How long will the U.S. economy continue to dance on the head of a pin between slow growth and recession is anyone's guess.  What powers stock prices is prosperity(what little there is) take that away and stock and bond(especially junk) prices will decline.  With prices in bubble land any recession will decimate prices.  DYI's best estimate is for stocks using the S&P 500 as our proxy to decline on the order of magnitude between 45% to 60%.  This decline would be "run of the mill" simply corresponding to the massive over valuation.

Updated Monthly

AGGRESSIVE PORTFOLIO - ACTIVE ALLOCATION -  4/1/16

Active Allocation Bands (excluding cash) 0% to 60%
85% - Cash -Short Term Bond Index - VBIRX
15% -Gold- Precious Metals & Mining - VGPMX
 0% -Lt. Bonds- Long Term Bond Index - VBLTX
 0% -Stocks- Total Stock Market Index - VTSAX
[See Disclaimer]
If the world wide economy goes into a tail spin pushing oil prices to a teenager level lump summing into the Adams Natural Resource fund symbol PEO for oil/gas/service companies will be on the give - away - table.  Gary Shilling an excellent economist with a great track record continues to believe it is still very possible and probable.  My take?  I'll be honest.  I don't know. However, be a Boy Scout...BE PREPARED!  If it does happen I'll be ready to snap up shares of PEO at bargain prices setting up for nice gains in the years ahead.


Time Bomb Ticking In The Global Bond Market—-$17 Trillion Of Governments Yield Less Than 1%, Duration Risk Soaring

Yields on $7.8 trillion of government bonds have been driven below zero by worries over global growth, meaning money managers looking for income are pouring into debt with maturities of as long as 100 years. Central banks’ policy is exacerbating matters, as the unprecedented debt purchases to spur their economies have soaked up supply and left would-be buyers with few options.
DYI Comments:  Just as with stocks our weighted formula has "kicked us out" of the debt markets. Interest rates using the U.S. 10 year Treasury note as our proxy is now on a price to interest basis 136% above its historical average since 1871.  Bubble land?  You bet it is.  However, as I've stated many times before deflation will continue to reign supreme for the next 4 to 6 years and for that time period those buying long dated bonds will be winners.  This will set up the backdrop to lull individuals and a good portion of professional investors to believe that deflation is permanent.  As the Boomers retire the pressure on government liabilities especially Social Security and Medicare Congress along with who ever is President will push the Federal Reserve to soak up the remaining costs through debasement(inflation).  The 2020's will be marked by high taxes, high inflation, increasing interest rates and a labor shortage(Boomers exit work force but continue to consume).

Long dated bonds such as 30 year Treasuries have been winners since 1981 when Fed Chief Paul Volker slammed on the brakes driving interest rates to the moon taming the inflation monster(that the Fed's created) setting up a long term bullish play on long dated debt.  Interest rates my even go negative here in the U.S. lulling investors into believing it is forever.  When the turn will happen I don't know but this secular bullish phase for bonds are at the tail end.       

Shocking admission by IRS commish

On March 18, the Commissioner of the Internal Revenue ServiceJohn Koskinen, filed his reply, in 11th Circuit Appeals case 16-10071. He admitted he did not and will not investigate and collect taxes, from the taxpayers identified giving and receiving kickbacks. The CIR admits he deliberately and knowingly blocked any investigations of the thousands of identified taxpayers violating the tax code per information relayed to the IRS office. He alleged that he has the discretionary authority not to conduct any investigation and not to collect any taxes due. He provided no statute giving him this authority. In all denials, the CIR never gave a reason why he used his discretionary authority. The Tax code says just the opposite, he is authorized and required to make inquires, determinations, assessments and collect all taxes under the tax code.
Our nation will continue to lose more manufacturing companies, then it creates. The cause of this is the burden of carrying the national healthcare costs. Until this cost is dramatically lowered, we will never be able to compete internationally. The Commissioner has not denied the facts the patients' bills determine the taxable revenue earned by the providers, or the difference between the amount billed and the amount paid by the insurance company is a kickback. 
 The way to break up this oligopoly, is the same way Al Capone was stopped, by enforcing our tax code. I have estimated the healthcare industry owes, 1.5 trillion dollars in uncollected taxes, for the kickbacks paid, for each of the past 6 years.
DYI Comments:  Corruption to the highest levels of government with an IRS chief that openly admits to playing favorites to whomever provides high amounts of campaign dollars.  A government that is up for sale. Any wonder why Trump and Sanders are doing so well.  The public are tired of this crap right along with this blogger as well.  I'm hoping this righteous indignation of the American public has political legs.  It will be needed in order to bring back the rule of law and imprison those such as IRS chief John Koskinen who believe that it is the rule of men.

DYI  

Monday, April 25, 2016

I continue to have little doubt that the current market cycle will be completed by a 40-55% market collapse. John Hussman of the Hussman Funds.


John P. Hussman, Ph.D.
It’s largely forgotten that during the 2000 top formation, the S&P 500 lost 12% from July-October 1999, recovered to fresh highs, retreated by nearly 10% from December 1999 to February 2000, recovered to fresh highs, experienced another 10% correction into May, recovered to a new high in total return (though not in price) on September 1, 2000, retreated 17% by December, and by January 2001 had recovered within 10% from its all-time high, and was unchanged from its level of June 1999.
DYI Quick Comment:  No doubt the U.S. stock market has created a massive top in the form of an arch. 
I continue to have little doubt that the current market cycle will be completed by a 40-55% market collapse, with near-zero total returns for the S&P 500 on a 10-12 year horizon. Meanwhile, however, we have to accept that central banks have wreaked havoc on the ability of the financial markets to usefully allocate capital toward productive ends. Relevant warning signs that would normally prevent misallocation and malinvestment have been repeatedly disabled in the advancing half-cycle since 2009.
DYI:  The only difference I have that the peak to trough decline will be the range of 45% to 60%! That makes Professor Hussman the optimist! 
There’s a story of an American golfer playing a Scottish course, and having hit the ball perfectly, a massive gust of wind carries the ball wildly off-course. The golfer complains “Did you see that wind take my ball?” The caddy looks at him, unfazed, “Aye, now you’ve got to play the wind too then, don’t you?” We feel the same about central bank distortions.
DYI:  Central banks will distort markets far longer than one believes is possible.  However, Mr. Market in the end will have the final word and that word will be bearish.  Valuations will regress back to the mean plus over shoot to the downside.  To finally end the mean inversion from bubble land beginning in the year 2000 to massive undervaluation [Shiller PE10 under 10] will take a few more years.

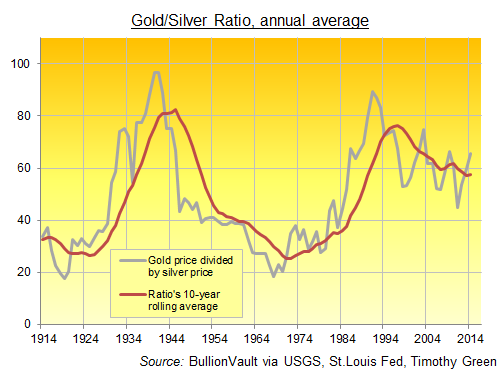
To give you an idea for how much time is needed just look at the chart below.  From 1907 to 1922 or 1966 to 1982.  The exception was 1929 to 1932.  First world market are on the long term version in reducing valuation metrics.  Here we are 17 years later except for a brief time period where valuations touched the mean in 2009 and then central bank money printing propelled markets back to bubble land.
  
I have to agree. This wouldn’t be the first time in history, nor even in the past century, that inept economic policy, class divisions, and growing nationalism led humanity to choose leaders that seduced them to abandon the better angels of their nature.
The same trend is apparent in our own political process. Speaking as someone who values human rights and diversity, some elements strike me as more offensive than others, but the current environment is bathed in the language of “enemy,” of division, of coercion, and of simplistic solutions. It also largely ignores the Federal Reserve’s role in creating the bubbles and crashes that still weigh on the economy, and now threaten a third act.
DYI:  There is no way to reform the Federal Reserve System.  First of all there are no reserves only a fiat currency back up only by the full faith and credit of the U.S. Government.  It was designed from day one to guarantee an underlining level of inflation to insure interest payments and continuous roll over of debt.  On top of that it is not a system but a banking cartel that favors primarily the New York banks.  Due to the Fed's bailout mentality this system encourages reckless lending.  Now that the Fed is over 100 years old the Fed itself has institutionalized reckless booms and busts as being normal. Despite the fact that with an induced inflation plus the booms and busts are crucifying the poor and slow motion destruction of the middle class.

To stop this insanity we must end the Fed and by the power of law end fractional lending by the commercial banks.  End legal tender laws.  Allowing our citizens to use in the private sector whatever form of currency they choose.  Swiss Francs, Euro's, Pounds, Yen, gold and/or silver or digital money allow the market to sort it out.  The only thing that is required a bank cannot by law loan out more than their deposits they can no longer be in the debt/money creation business.  If caught and no doubt some will it will be deemed fraud and the bad actors would be fined and imprisoned.        

So....The Fed's have us set up for another bust just the timing is impossible to determine. My model portfolio remains steadfastly defensive.
Updated Monthly

AGGRESSIVE PORTFOLIO - ACTIVE ALLOCATION -  4/1/16

Active Allocation Bands (excluding cash) 0% to 60%
85% - Cash -Short Term Bond Index - VBIRX
15% -Gold- Precious Metals & Mining - VGPMX
 0% -Lt. Bonds- Long Term Bond Index - VBLTX
 0% -Stocks- Total Stock Market Index - VTSAX
[See Disclaimer]

 This blog site is not a registered financial advisor, broker or securities dealer and The Dividend Yield Investor is not responsible for what you do with your money.
This site strives for the highest standards of accuracy; however ERRORS AND OMISSIONS ARE ACCEPTED!
The Dividend Yield Investor is a blog site for entertainment and educational purposes ONLY.
The Dividend Yield Investor shall not be held liable for any loss and/or damages from the information herein.
Use this site at your own risk.
PAST PERFORMANCE IS NO GUARANTEE OF FUTURE RESULTS.

DYI

Saturday, April 23, 2016

Generational Dynamics

S&P 500 Price/Earnings ratio rockets to highest value in years

As regular readers know, Generational Dynamics predicts that we're headed for a global financial panic and crisis. According to Friday's Wall Street Journal, the S&P 500 Price/Earnings index (stock valuations index) on Friday morning (April 22) was at an astronomically high 24.11. This is far above the historical average of 14, indicating that the stock market is growing quickly, and could burst at any time. Generational Dynamics predicts that the P/E ratio will fall to the 5-6 range or lower, which is where it was as recently as 1982, resulting in a Dow Jones Industrial Average of 3000 or lower.
 S&P 500 Price/Earnings ratio at 24.11 on April 22, indicating a huge and rapidly growing stock market bubble (WSJ)
The rapidly rising P/E ratio is a sure sign of trouble. The last time that the P/E ratio rose above 24 was in April 2008. For the year following, the Dow Jones Industrial Average fell about 50% to the 6000s level in May 2009. 
As the stock market was falling, the Federal Reserve began its massive quantitative easing program in December 2008, "printing" new money and pumping it into the banking system, from which it went into the stock market. The P/E ratio fell below 24 again in December 2008. 
Since then, the Fed has lowered interest rates almost to zero, and there is talk of negative interest rates, which are already the policy in several other countries, with little effect. ( "11-Mar-16 World View -- In desperation move, European Central Bank further lowers negative interest rates") 
If you listen to CNBC or Bloomberg TV, as I do for as long as I can stand it, all they talk about is interest rates set by the Fed and other central banks. No one seriously believes any more that the stock market has any relation to the real economy. As long as the Fed pumps money into the stock market, it will go up; if the Fed stops, then it will go down. 
The reason that stock valuations are surging is because earnings (the denominator of the P/E ratio) are plummeting. During the first quarter, earnings have declined 8.9%, with the result that the P/E ratio is pushed up. 
The stock market bubble is getting larger and larger, and there's going to be a lot of political pressure for the Fed to pump it even larger, especially from the Obama administration in an election year. But there is no bubble in history that hasn't burst, and this one is no exception. The amount of pain that it will cause will be enormous. Factset Earnings Insight (PDF)
DYI 

Friday, April 22, 2016

The Shocking Reason for FATCA… and What Comes Next

FATCA is a U.S. law that forces every financial institution in the world to give the IRS information about its American clients. Complying with it is a huge financial and administrative burden, measured in hundreds of billions of dollars. It’s a paper shuffler’s dream come true. 
FATCA is the reason the vast majority of banks, brokerages, and other financial institutions outside of the U.S. shun American clients. 
I was just in Singapore, which has one of the soundest banking systems in the world. I can personally attest that banks there treat potential American clients as radioactive liabilities to be avoided. 
This is how FATCA makes it much more difficult to move money outside of the U.S. Combined with other costly, extraterritorial U.S. regulations, the law amounts to de facto capital controls.
DYI Comments:  Unfunded liabilities especially for Medicare and Social Security will have deficits beginning most likely next year and then continue to grow in size as the Boomer generation retires. The Fed's will be ravenous for tax dollars to fund the insatiable beasts Medicare and Social Security. Capital controls is just one measure along with tax increases of all types and the remaining will be reduced by the tax of inflation.  Currently today and the next 4 to 7 years deflation will reign but once the liabilities become over whelming the inflation genie will be let out of the bottle.
 
The 2020's will be known as the roaring 20's marked by high taxes, high inflation, and a labor shortage as Boomer's exit the work force but are still alive and consuming(at a lesser rate).

DYI   

This is the one thing I’m buying right now: Ron Paul

According to Paul, with many assets around the world in bubble territory, silver could be one of the safer places for investors to hide. 
"I wouldn't buy bonds. I think that's in a huge bubble," he said. In addition to bonds, Paul noted that the air is beginning to get let out of the U.S. dollar as well as equities. 
"We are defying gravity. These things can't go up forever," he said. "I think we are facing a downturn that's probably a lot worse than 2008-2009."
DYI Comments:  For those of you who hold physical gold and silver currently today the ratio of gold to silver is 73 to 1.  Silver is the better bargain as compared to gold.  Either silver is in a bull market or gold is going to retrace maybe some of both.  Which ever way it goes this sets up the trade to increase your grams/ounces precious metals holdings.  Gold is on the high end of its trading range as compared to silver.
 
DYI

Thursday, April 21, 2016

This Also Happened the Last 2 Times before Stocks Crashed

Downgrades ascribed to “shareholder compensation,” as Moody’s calls share buybacks and dividends, have been soaring, according to John Lonski, Chief Economist at Moody’s Capital Markets Research. The moving 12-month sum of Moody’s credit rating downgrades of US companies, jumped from 32 in March 2015, to 48 in December 2015, and to 61 in March 2016, nearly doubling within a year. 
The last time the number of downgrades attributed to financial engineering reached 61 was in early 2007. It would hit its peak of 79 in mid- 2007, a few months before the beginning of the Great Recession in Q4 2007. At the time, stocks were on the verge of commencing their epic crash.
DYI 

South China Sea Controversy: China’s Maritime Patrol Aircraft Makes First Public Landing On Disputed Island

A Chinese military aircraft made the first public landing on a disputed island in the South China Sea Sunday, state media reported Monday, raising concerns that Beijing could base fighter jets there. The aircraft, which was patrolling over the islands claimed by China, reportedly made an emergency landing on the Fiery Cross Reef to evacuate three seriously ill workers. 
According to China's official People's Liberation Army Daily, the aircraft was sent by the navy after they received an emergency call from the construction site on the reef. The United States has criticized China's construction of artificial islands in disputed waters, through which about $5 trillion of maritime trade passes every year. Pentagon believes China, which claims most of the South China Sea, aims to use the constructions for military purposes.

Going Blue: The Transformation of China’s Navy

The bad smell hovering over the global economy


Don’t be fooled. China’s growth is the result of a surge in investment and the strongest credit growth in almost two years. There has been a return to a model that burdened the country with excess manufacturing capacity, a property bubble and a rising number of non-performing loans. The economy has been stabilised, but at a cost. 
The upward trend in oil prices also looks brittle. The fundamentals of the market - supply continues to exceed demand - have not changed. 
Then there’s the US. Here there are two problems – one glaringly apparent, the other lurking in the shadows. The overt weakness is that real incomes continue to be squeezed, despite the fall in unemployment. Americans are finding that wages are barely keeping pace with prices, and that the amount left over for discretionary spending is being eaten into by higher rents and medical bills. 
For a while, consumer spending was kept going because rock-bottom interest rates allowed auto dealers to offer tempting terms to those of limited means wanting to buy a new car or truck. In an echo of the subprime real estate crisis,vehicle sales are now falling.  
The hidden problem has been highlighted by Andrew Lapthorne of the French bank Société Générale. Companies have exploited the Federal Reserve’s low interest-rate regime to load up on debt they don’t actually need.
 GDP Now 2016-04-20

By this measure, the S&P 500 is overvalued by 72%

Going back to 1964, the S&P 500's market cap has been 57 percent of annual US GDP on average. If one excludes the tech bubble, that number falls to 53 percent. As of the end of March, however, the stocks contained within the S&P are collectively worth 99 percent of GDP, more than 70 percent above the average level.
DYI Comments:  Except for the last six weeks during 1929 and the year 2000 this market is no doubt on the high end for valuations.  The market continues to trace a long broad top testing one's patience.  I've named this period of time "The Great Wait!"  And indeed it is.  DYI are NOT market timers.  This blog is a valuation player and currently values are so high our formula has "kick us out" of the market and rightfully so!  My expectations is for a run of the mill decline from peak to trough of 45% to 60%.  Run of the mill?  Yes!  Valuations are simply that high.
 Updated Monthly

AGGRESSIVE PORTFOLIO - ACTIVE ALLOCATION -  4/1/16

Active Allocation Bands (excluding cash) 0% to 60%
85% - Cash -Short Term Bond Index - VBIRX
15% -Gold- Precious Metals & Mining - VGPMX
 0% -Lt. Bonds- Long Term Bond Index - VBLTX
 0% -Stocks- Total Stock Market Index - VTSAX
[See Disclaimer]

DYI


Tuesday, April 19, 2016


John P. Hussman, Ph.D.
Based on valuation measures having the strongest correlation with actual subsequent market returns across history, equity valuations have approached present levels in only a handful of instances: 1901 (followed by a -46% market retreat over the following 3-year period), 1906 (followed by a -45% retreat over the following year), 1929 (followed by a -89% collapse over the following 3 years), 1937 (followed by a -48% loss over the following year), 2000 (followed by a -49% market loss over the following 2 years), and 2007 (followed by a -57% market loss over the following 2 years). A few lesser extremes occurred in the 1960’s and 1970’s, followed by market losses in the -35% to -48% range.
Still, history doesn’t unfold at random. One can often anticipate the future harvest by examining the seeds that are sown in the present. Long periods of yield-seeking speculation create an illusion of stability in the present, but produce an inevitable harvest of crisis. Long periods of obscene overvaluation create an illusion of permanently high plateaus, but produce an inevitable harvest of poor long-term returns and wicked losses that complete those market cycles.
Overall, the stock market continues to trace out a broad arc that we view as the top-formation of the third speculative bubble in 16 years.  A marginal new high, if it emerges, would not change that broad assessment. Those who recall the marginal new highs of the S&P 500 in September 2000 (on a total return basis) and October 2007 are well aware that they didn’t represent any sort of “all clear” for the market. Meanwhile, we’re very familiar with the seeds that have been planted by the recent speculative episode, and we believe that the best approach for investors here is to wait for the rain, and be patient for the harvest to follow.
DYI Comments:  Here at DYI we call this broad arc for stock prices "The Great Wait."  With valuation so obscene the return OF your principal is far more important than the return ON your principal.  Here at DYI will leave speculation to others and put money to work when valuations are in our favor.

DYI     

Report: Saudis vow to sell US assets if Congress decides gov was involved in 9/11

The revelations about the Saudis’ ultimatum come several days after reports that President Obama will soon decide whether to declassify 28 pages of sealed documents suspected of showing a Saudi connection to the deadly 9/11 terror attacks.

DYI Comments:  Once the American public finds out how deeply the Saudi's were involved American's will demand retribution.  No doubt the Saudi's will sell off their Treasury bonds along with other holdings to keep from having their assets placed into forfeiture.  Another big blow to relations between the U.S. and Saudi Arabia when Obama threw Hosni Mubarak of Egypt to the wolves during the Arab spring.  As relationship with Saudi's arch enemy Iran begins to improve the Saudi's will distant themselves from the U.S. and begin to align with China.  The possibility of world war is gathering speed with the U.S., India, Russia, and Iran as the Allies and Axis powers with China, Pakistan, Saudi Arabia, and the remaining Sunni Muslim countries.

Here’s why Doha failed to deliver an oil deal

On the geopolitical front, the Saudis are becoming more independent. The Iran nuclear deal was the latest blow to their esteem. They fear a detente between Washington and Iran, while still a long way off, will diminish their clout in the region. 
Iran, meanwhile, had always made it crystal clear it had no intention of entertaining a role in an output freeze. With the lifting of sanctions, Iran is eager to sell every additional barrel it can produce and has no incentive, even with oil prices at recent lows, not to stop producing until it hits its goal of producing at its pre-sanctions level of 4 million barrels a day.
It’s taken longer than Riyadh undoubtedly expected, but the Saudis are finally getting what they wanted in terms of routing out higher-cost oil producers. There was simply no incentive on Sunday for the Saudis to give up now, but it was an opportunity to show other OPEC members it would entertain the idea while ultimately putting the blame for failure on Iran.
DYI 

Friday, April 15, 2016

Divert Course: Beijing Needs A Way To Save Face in the South China Sea

DYI Comments:  An effective strategy is similar to the hay day(1940-1970) for the unions when they would demand outrageous pay and benefit increases and go on strike, only to negotiate a lessor but far better deal if more reasonable demands were stated in the beginning.  It appears China is playing the same game.

DYI

What in the World’s Going on with Banks this Week? Emergency Meetings, Summits, Crashing EU Banks…

  • The Federal Reserve Board of Governors just held an “expedited special meeting” on Monday in closed-door session.
  • The White House made an immediate announcement that the president was going to meet with Fed Chair Janet Yellen right after Monday’s special meeting and that Vice President Biden would be joining them.
  • The Federal Reserve very shortly posted an announcement of another expedited closed-door meeting for Tuesday for the specific purpose of “bank supervision.”
  • A G-20 meeting of finance ministers and central-bank heads starts in Washington, D.C., on Tuesday, too, and continues through Wednesday.
  • Then on Thursday the World Bank and the International Monetary Fund meet in Washington.
  • The Federal Reserve Bank of Atlanta just revised US GDP growth for the first quarter to the precipice of recession at 0.1%.
 GDPnow 2016-04-13
  • US banks are expected this coming week to report their worst quarter financially since the start of the Great Recession.
  • The press stated that the German government will sue the European Central Bank if it launches a more aggressive and populist form of quantitative easing, often called “helicopter money.”
  • The European Union’s new “bail-in” procedures for failing banks were employed for the first time with Austrian bank Heta Asset Resolution AG.
  • Italy’s minister of finance called an emergency meeting of Italian bankers to engage “last resort” measures for dealing with 360-billion euros of bad loans in banks that have only 50 billion in capital.
 Analysts say it has been the worst start to the year since the financial crisis in 2007-2008 and expect poor first-quarter results when reporting begins this week…. Analysts forecast a 20 percent decline on average in earnings from the six biggest U.S. banks, according to Thomson Reuters I/B/E/S data. Some banks, including Goldman Sachs Group Inc (GS.N), are expected to report the worst results in over ten years. (Reuters) 
Could that have had anything to do with the flurry of bank meetings in the US. I have no idea, but I do have to wonder, with so much smoke everywhere in the banking industry, is there a fire we need to know about? You can be sure, we’ll be the last to know, and any announcement of what’s really going down will hit like Bear Sterns or Lehman Brothers. One day, all the central bankers are talking like things are fine. The next day a major vertebrae is knocked out of the nation’s financial spine. 
Or maybe presidents and central bankers are just making sure things generally hold together through the election cycle. Such a bad-news week for banks around the world certainly doesn’t sound like all is well as our smiling central bankers, president and V.P, say it is. I don’t know any top secrets to reveal, but the smoke is killing me. By David Haggith, The Great Recession Blog
BI6
DYI Comments:  How long is it possible for the economy to dance on the head of a pin between slow growth and recession is anyone's guess.  My best guess for some time for trouble with the banks will begin in Europe as their indebtedness is on a scale developed by a madman.  With the stock and bond markets in a bubble looking for a pin Europe may just be it!

Nothing has changed with my model portfolio; remains very defensive except for a modest gold mining position.
Updated Monthly

AGGRESSIVE PORTFOLIO - ACTIVE ALLOCATION -  4/1/16

Active Allocation Bands (excluding cash) 0% to 60%
85% - Cash -Short Term Bond Index - VBIRX
15% -Gold- Precious Metals & Mining - VGPMX
 0% -Lt. Bonds- Long Term Bond Index - VBLTX
 0% -Stocks- Total Stock Market Index - VTSAX
[See Disclaimer]

DYI

Thursday, April 14, 2016

Goldman Sachs will pay $5B for fraudulent sales of toxic debt, no one will go to jail

No one at Goldman Sachs will go to jail despite the company's world-destroying, multi-billion-dollar frauds that culminated in its unloading billions' worth of worthless mortgage-backed securities on its customers just before the crash. 
Goldman's settlement requires it to admit that it knowingly committed these frauds for years on end. 
Again, no one will go to jail.
DYI Comments:  Fines after fines now in the multi-billion dollar level and almost a decade has past yet no one goes to jail.  What will it take?  The entire financial system collapses is what it will take before at least one individual spends at least one day in jail.  Time will only tell.

DYI

Tuesday, April 12, 2016

We have warned in the past about the potential for a world-wide deflationary bear market accompanied by a U.S., and possibly, global recession.  We believe this recession and deflationary bear market have begun and expect it will last through most of 2016 and into 2017. 
Two weeks ago Barron’s Magazine ran a cover story titled “Stormy Seas”.  The authors were essentially on the other side of this debate, by claiming “Despite Turbulent Markets”, the U.S. economy will avoid a recession and grow at a healthy 3% pace this year. However, even if Barron’s is correct and the U.S. economy grows at 3%, this would still be the slowest recovery since World War II. 
Below are nine reasons that we believe there will be a US and possible global recession in 2016. 
The S&P 500 peaked in mid-2015 at 2135 and broke through many areas of support on the way down to the 1800-1812 area.  Though it successfully tested that area in both January and February, we believe that 1800 will prove an important psychological level that will be breached in short/intermediate term.  When this occurs we believe the potential will be there for a rapid and significant move lower.
 Q and its Geometric Mean
The spread between the 10 year US Treasury and the 2 year US Treasury (flattening yield curve) is now just 83 basis points; the lowest level since late 2007.  This is a deflationary indicator.
Yield Closeup 
According to Bloomberg, high yield bond issuance was down 72% in February versus 1 year ago. Notable was the complete absence of issuance by energy and materials firms; a possible indication that financing is not available.  This has implications for future default rates. 
The Bloomberg Commodity Index, which is calculated back to 1991 and is broadly representative of the commodity complex, made a new all-time low in January and currently is 68% below its all-time high set in September of 2008. Gold has been rallying over the past few months as investors are worried about currency debasement and negative interest rates. Negative real interest rates can occur because interest rates are low relative to some inflation (now) or interest rates are not high enough to compensate for hyper-inflation (a possibility in the future as governments further debase currencies).
 
ISM manufacturing [below] has been below 50 for five months and is now 49.5.  50 is the break point between expansion and contraction. [Just recently April 1st data is now positive]
 Since 2000
Downward earnings revisions, according to data compiled by Bloomberg, are happening at double the average pace of the last five years with profits seen dropping the most since the global financial crisis. 
The Atlanta Federal Reserve just lowered its forecast of 1st quarter GDP to 1.9% down from 2.1%.[Revised numbers are lower]  Also significant is that its forecast of real consumer spending growth was lowered from 3.5% to 3.1%. 
 
Fear and Loss of Confidence in Central Banks.  The Fed is looking at everything they can before raising rates again---weakness in global markets as well as all financial data.  Other Central Banks are also guessing after the Fed made significant decisions for the past 7 years –i.e., zero interest rate policies as well as increasing the balance sheet from $800 bn to $4.5 tn. They are now scared to death about the “unintended consequences” of their moves—especially after lowering rates in 2003 causing the housing bubble and the “great recession”.  They are especially nervous knowing that so many countries have taken on so much debt over the past few years without generating enough income to pay the debt down.  We believe that debt restricts economic recovery and will probably cause “Deflation” (see attached “Cycle of Deflation”).  This debt has caused many countries to fall into recessions (e.g. Brazil, Venezuela and a major slowdown in China) and its effect has yet to be fully realized. Lastly and on a separate note, the people running for the Presidency have us very concerned.  On the Democratic side they are talking about income inequality and how they can tax and spend more to alleviate it.  There has been not a mention of the fact that ZIRP has been the policy of our Federal Reserve.  Zero interest rates are their dictum, not the outcome of a free market price determined by the true supply and demand of money.   It did not precede income inequality but has certainly exacerbated it as those with financial assets, real estate and collectibles have benefitted. 
On the Republican side the front runners are in a food fight and demeaning themselves, our system and the office they seek.  No one, since Rand Paul dropped out, is talking about $19tn in debt and potentially $200tn in unfunded liabilities that are not going away and in fact growing.  We believe this to be the most important economic factor that will influence the quality of our children’s and grandchildren’s lives.  It is so large an influence that it has implications for many things including defense, infrastructure and social spending.  They in turn will factor into our security, quality of life and social order. And that is about as important as it gets!
DYI Comments:  The U.S. economy has certainly been dancing on the head of a pin between slow growth and recession.  The U.S. stock and bond market(especially junk bonds) are very overvalued. Central banks with sub atomic low interest rates have levitated the price of stocks and bonds and to a lessor degree real estate here in the U.S.  Also low oil prices has provided an extra boost to security prices as well.

No doubt when it comes to our unfunded liabilities [Social Security and Medicare] taxes will be be raised just below the boiling point, benefit reductions, and the remainder will be paid by central bank money creation(inflation).  This is why DYI is forecasting the 2020's as the age of inflation.  Most likely starting around 2022.  Between now and then deflation is more likely outcome pulverizing the U.S. stock market from peak to trough 45% to 60%[DYI's estimation].  Below is what John Hussman has to say in his latest weekly report.
April 11, 2016
John P. Hussman, Ph.D.

The single most important quality that investors can have, at present, is the ability to maintain a historically-informed perspective amid countless voices chanting “this time is different” and arguing that long-term investment returns have no relationship to the price that one pays. [Amen John Hussman, spot on!]
From a long-term, historically-informed investment perspective, the S&P 500 remains obscenely overvalued on valuation measures most closely correlated with actual subsequent market returns (and that have remained tightly correlated with actual market returns even in recent cycles). We estimate that S&P 500 nominal annual total returns will average only about 0-2% on a 10-12 year horizon, with negative expected real returns after inflation. From a cyclical perspective, we continue to expect the S&P 500 to retreat by about 40-55% over the completion of the current market cycle; an outcome that we would view as run-of-the-mill and that would in no way represent a worst-case scenario. Every market cycle in history has drawn valuations toward or below levels consistent with expectations of 10% nominal annual returns over a 10-12 year horizon. This includes cycles prior to the 1960’s when interest rates regularly visited levels similar to the present.
DYI Comments:  A worst case scenario [not a DYI forecast] the market from peak to trough to decline by 85%.  The Fed's would have to react in almost in every situation in a wrong headed manner.  This is what happened during the 1930's with one stupid economic legislation after another. I know history can repeat itself but let's stay optimistic as least for now.

DYI's model portfolio hasn't changed....The Great Wait Continues....
 Updated Monthly

AGGRESSIVE PORTFOLIO - ACTIVE ALLOCATION -  4/1/16

Active Allocation Bands (excluding cash) 0% to 60%
85% - Cash -Short Term Bond Index - VBIRX
15% -Gold- Precious Metals & Mining - VGPMX
 0% -Lt. Bonds- Long Term Bond Index - VBLTX
 0% -Stocks- Total Stock Market Index - VTSAX
[See Disclaimer]

DYI