%
Gold/Silver
Allocation
1-1-2026
Updated Monthly
100 x (Current GS – Avg. GS / 4)
_______________________________________
(Avg.GS x 2 – Avg. GS / 2)
[The formula's answer allocates silver percentage]
[The formula's answer allocates silver percentage]
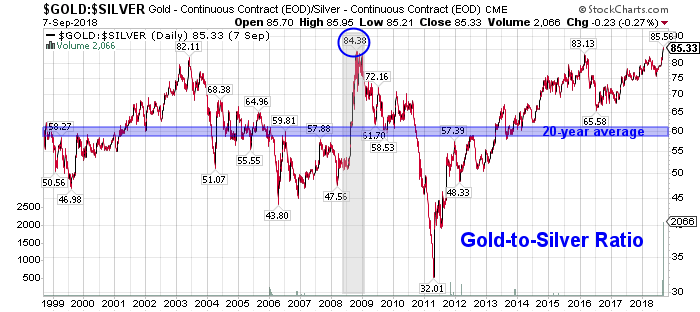
Current Gold/Silver Ratio 60 (rounded)
Average Gold/silver Ratio 50 [Averaged from year 1900]
Allocation:
Gold 37%
Silver 63%

Average Gold/Silver Ratio since 1900
50 to 1
Gold and silver bullion buyers and
traders use the fluctuating Gold Silver Ratio to better determine which
precious metal may be poised to outperform the other.
The essence of trading the gold-silver ratio
is to switch holdings when the ratio swings to historically determined
extremes.
So...
So...
When a trader possesses one ounce of gold and
the ratio rises to an unprecedented 100, the trader would sell their single
gold ounce for 100 ounces of silver.
When the ratio then contracted to an opposite
historical extreme of 50, for example, the trader would then sell his or her
100 ounces for two ounces of gold.
In this manner, the trader would continue to
accumulate quantities of metal seeking extreme ratio numbers to trade and
maximize holdings.
Note that no dollar value is considered when
making the trade;
the relative value of the metal is considered unimportant.
DYI’s averaging formula is best used when
accumulating bullion. Simply buy up to
the stated allocation only selling/buying when necessary [lessen capital gains
taxes]. For those in the distribution stage
[retirees] of life sell off gold or silver to bring back in line with the
current allocation.
DYI
No comments:
Post a Comment