Sunday, May 31, 2020

Margin of Safety!

Central Concept of Investment for the purchase of Common Stocks.
"The danger to investors lies in concentrating their purchases in the upper levels of the market..."

Stocks compared to bonds:
Earnings Yield Coverage Ratio - [EYC Ratio]

EYC Ratio = 1/PE10 x 100 x 1.1 / Bond Rate

1.75 plus: Safe for large lump sums & DCA

1.30 Plus: Safe for DCA

1.29 or less: Mid-Point - Hold stocks and purchase bonds.

1.00 or less: Sell stocks - Purchase Bonds

Current EYC Ratio: 1.44(rounded)
As of  6-1-20
Updated Monthly

PE10 as report by Multpl.com
DCA is Dollar Cost Averaging.
Lump Sum any amount greater than yearly salary.

PE10  ..........28.62
Bond Rate...2.67%

Over a ten-year period the typical excess of stock earnings power over bond interest may aggregate 4/3 of the price paid. This figure is sufficient to provide a very real margin of safety--which, under favorable conditions, will prevent or minimize a loss......If the purchases are made at the average level of the market over a span of years, the prices paid should carry with them assurance of an adequate margin of safety.  The danger to investors lies in concentrating their purchases in the upper levels of the market.....

Common Sense Investing:
The Papers of Benjamin Graham
Benjamin Graham
%
Stock & Bonds
Allocation Formula
6-1-20
Updated Monthly

% Allocation = 100 – [100 x (Current PE10 – Avg. PE10 / 4)  /  (Avg.PE10 x 2 – Avg. PE10 / 2)]


% Stock Allocation   2% (rounded)
% Bond Allocation  98% (rounded) 

Logic behind this approach:
--As the stock market becomes more expensive, a conservative investor's stock allocation should go down. The rationale recognizes the reduced expected future returns for stocks, and the increasing risk. 
--The formula acknowledges the increased likelihood of the market falling from current levels based on historical valuation levels and regression to the mean, rather than from volatility. Many agree this is the key to value investing.  
Please note there is controversy regarding the divisor (Avg. PE10).  The average since 1881 as reported by Multpl.com is 16.70.  However, Larry Swedroe and others believe that using a revised Shiller P/E mean of 19.6 , the number since 1960 ( a 53-year period), reflects more modern accounting procedures.


DYI adheres to the long view where over time the legacy (prior 1959) values will be absorbed into the average.  Also it can be said with just as much vigor the last 25 years corporate America has been noted for accounting irregularities.  So....If you use the higher or lower number, or average them, you'll be within the guide posts of value.

Please note:  I changed the formula when the Shiller PE10 is trading at it's mean stocks and bonds will be at 50% - 50% representing Ben Graham's Defensive investor starting point; only deviating from that norm as valuations rise or fall.        
  
DYI


This blog site is not a registered financial advisor, broker or securities dealer and The Dividend Yield Investor is not responsible for what you do with your money.
This site strives for the highest standards of accuracy; however ERRORS AND OMISSIONS ARE ACCEPTED!
The Dividend Yield Investor is a blog site for entertainment and educational purposes ONLY.
The Dividend Yield Investor shall not be held liable for any loss and/or damages from the information herein.
Use this site at your own risk.

PAST PERFORMANCE IS NO GUARANTEE OF FUTURE RESULTS.

The Formula.
Updated Monthly

AGGRESSIVE PORTFOLIO - ACTIVE ALLOCATION - 6/1/20

Active Allocation Bands (excluding cash) 0% to 50%
62% - Cash -Short Term Bond Index - VBIRX
38% -Gold- Global Capital Cycles Fund - VGPMX **
 0% -Lt. Bonds- Long Term Bond Index - VBLTX
 0% -Stocks- Total Stock Market Index - VTSAX
[See Disclaimer]
** Vanguard's Global Capital Cycles Fund maintains 25%+ in precious metal equities the remainder are domestic or international companies they believe will perform well during times of world wide stress or economic declines.  

 This blog site is not a registered financial advisor, broker or securities dealer and The Dividend Yield Investor is not responsible for what you do with your money.
This site strives for the highest standards of accuracy; however ERRORS AND OMISSIONS ARE ACCEPTED!
The Dividend Yield Investor is a blog site for entertainment and educational purposes ONLY.
The Dividend Yield Investor shall not be held liable for any loss and/or damages from the information herein.
Use this site at your own risk.

PAST PERFORMANCE IS NO GUARANTEE OF FUTURE RESULTS.

Saturday, May 30, 2020

Freedom
Lockdown

The CDC confirms remarkably low Coronavirus death rate. Where is the media?

The CDC just came out with a report that should be earth-shattering to the narrative of the political class, yet it will go into the thick pile of vital data and information about the virus that is not getting out to the public. For the first time, the CDC has attempted to offer a real estimate of the overall death rate for COVID-19, and under its most likely scenario, the number is 0.26 percent. Officials estimate a 0.4 percent fatality rate among those who are symptomatic and project a 0.35 percent rate of asymptomatic cases among those infected, which drops the overall infection fatality rate (IFR) to just 0.26 percent — almost exactly where Stanford researchers pegged it a month ago.


More importantly, as I mentioned before, the overall death rate is meaningless because the numbers are so lopsided. Given that at least half of the deaths were in nursing homes, a back-of-the-envelope estimate would show that the infection fatality rate for non-nursing home residents would only be 0.1 percent or 1 in 1,000. And that includes people of all ages and all health statuses outside of nursing homes. Since nearly all of the deaths are those with comorbidities.


Are You Ready For Your...Immunity Passport?

Think of it as the REAL ID on steroids. The airlines and sectors of government are pushing for a biometric "immunity passport" to prove that one is not corona contagious before flying, attending large events, maybe even going to work. Plus today's program will look at another pandemic: depression and anxiety as a result of the shutdown. And Minnesota Governor Tim Walz emptied out hospitals and cancelled surgeries to make way for a coronavirus tidal wave that never hit. Finally, freedom action in Brazoria County as homeschoolers challenge park shutdowns.

Coronavirus Propaganda Mimics War Propaganda

In the period leading up to the US invasion of Iraq in 2003, the Bush administration and its media accomplices waged a relentless propaganda campaign to win political support for what turned out to be one of the most disastrous foreign policy mistakes in American history.

Tragically, the American people never placed the burden of proof squarely with the war cheerleaders to justify their absolutely crazed effort to remake the Middle East. In hindsight, this is obvious, but at the time propaganda did its job. Disinformation is part and parcel of the fog of war.

What will hindsight make clear about our reaction to COVID-19 propaganda? Will we regret shutting down the economy as much as we ought to regret invading Iraq?

The cast of characters is different, of course: Trump, desperately seeking "wartime president" status; Dr. Anthony Fauci; epidemiologist Neil Ferguson; state governors such as Cuomo, Whitmer, and Newsom; and a host of media acolytes just itching to force a new normal down our throats. Like the Iraq War architects, they use COVID-19 as justification to advance a preexisting agenda, namely, greater state control over our lives and our economy. Yet because too many Americans remain stubbornly attached to the old normal, a propaganda campaign is required.

Propaganda kills, but it also works. Politicians of all stripes will benefit from the coronavirus; the American people will suffer. Perversely, one of the worst COVID propagandists—the aforementioned Governor Andrew Cuomo of New York—yesterday rang the bell as the New York Stock Exchange reopened to floor trading. He now admits that the models were wrong and that his lockdown did nothing to prevent the Empire State from suffering the highest per capita deaths from COVID. Like the architects of the Iraq War, he belongs on a criminal docket. But thanks to propaganda, he is hailed as presidential.
DYI

Sunday, May 24, 2020


Fred's Intelligent Bear Site brought to you by Fred Filskov. Public, private, and commercial distribution of this material is permitted as long as a link to this site is attached.
As of 5/22/20
Dow/Gold Ratio
14 to 1 
(rounded)

In 1913 the US central bank began (i.e., Federal Reserve) and in that time frame, the US dollar has lost over 98.5% of its value to gold.

I fully expect with the current gold fundamental investment backdrop today to again see a similar fall in the Dow Gold Ratio akin to the 1976-1980 version.

Perhaps this coming rollover shall have a longer duration and further to fall as we are coming off two of the most gigantic US stock market bubbles ever formed (2001, 2019).

The lack of median Baby Boomer savings and underfunded pension dynamics guarantee the financial authorities will again intervene in our supposed free markets attempting still to prop up paper asset values as best they can, for as long as they can.

Will the Dow Jones Industrial Average index eventually reach parity with the fiat Federal Reserve Note price of gold? Or will we have had a currency crisis and financial restructuring before witnessing such a moment in the time ahead?

We suggest now is time to consider owning a prudent position in gold bullion for all stock price bubbles eventually give way to precious monetary commodity values in time. Just look at the charts above, and then ask yourself which way you think they generally will go in the coming decade.
DYI

Friday, May 22, 2020


Gary Shillings on big governments getting bigger

Wednesday, May 6, 2020

Gary Shillings talks about US Government policies and what can be done to improve the US economy and encourage people to work.


The corona-virus pandemic and its devastating effect on the U.S. economy has ensured that big government–the one that’s already spending some $4.7 trillion in the current fiscal year–is poised to get even larger. As in past crises that led to massive government interventions, new initiatives will largely stay in place once the business downturn ends to the long-term detriment of the economy, despite the “temporary” intentions of these programs.

Ronald Reagan once likened a government program to “the nearest thing to eternal life we’ll ever see on this earth.” A look at history suggests that once a new program or a new agency is established, with few exceptions, it stays established, regardless of whether it was intended to be temporary, whether it’s still needed and whether it actually solved the problem it was created to address.


Before the 1930s economic collapse, there was no federal safety net. State and local governments as well as charities generally looked after the less-fortunate, there were few pension systems in the U.S. and Washington’s role in providing assistance was minimal. The federal budget in 1929 amounted to about $3 billion, or 3% of total output, a fraction of today’s $4.7 trillion budget that accounts for some 21% of gross domestic product. That number will surely grow as federal spending surges, the  economy shrinks and tax collections fall.


The Great Depression marked the start of far-reaching and long-lasting federal government involvement in the economy as Washington strived to blunt the impact of the economic free-fall. The New Deal saw the establishment of numerous “alphabet agencies,” many of which still exist but only bigger and more costly.

The CCC (Civilian Conservation Corps), TVA (Tennessee Valley Authority), REA (Rural Electrification Administration), WPA (Works Progress Administration), FDIC (Federal Deposit Insurance Corp.) and the SEC (Securities and Exchange Commission) were among some of the first New Deal agencies. They were followed by the establishment in 1935 of Social Security, which has grown into a $1 trillion behemoth that is now at risk of running out of money.

The first food stamp program was established in 1939 and ran for four years, followed in 1964 by the establishment of the program that today is called the Supplemental Nutrition Assistance Program and costs close to $70 billion annually.

The 1960s Great Society efforts saw tremendous increases in federal involvement in many areas of American life, almost all of which have survived to this day, starting with the establishment of Medicare and Medicaid, whose costs continue to multiply. These programs eventually widened to include child nutrition, education, rural and urban development, affordable housing, air and water pollution levels, consumer protection and the availability of arts funding. Meanwhile, the Departments of Transportation and Housing & Urban Development were created during the Johnson administration along with the Environmental Protection Agency.

Disdain for government in general was a big factor in Reagan’s election, but despite his declaration that government was the problem and not the solution, the vast federal bureaucracy remained intact during his presidency and has only grown. The Departments of Energy, Education, Veteran’s Affair and Homeland Security are entrenched, and the Consumer Finance Protection Bureau survives despite being a top target of Congressional Republicans.

Meanwhile, Social Security and Medicare benefits have been greatly expanded, and many federal programs created over the past 90 years remain in existence, some with changed mandates and others with questionable results. The REA succeeded in supplying electric power to farms and rural areas, but vestiges of the agency remain in place today. 

I can find only a few agencies that have been eliminated outright, starting with the Civil Aeronautics Board, which was established in 1938 to oversee aviation services and dissolved when the airline industry was deregulated in 1978. The Synthetic Fuels Corp. was established in 1980 to spearhead production of alternative fuels, but it ended up funding just four synthetic fuels projects, none of which survive today, before being abolished in 1986. With the recovery of the financial system from the 2008 crisis, some provisions of Dodd-Frank have been scaled back but key measures, like large bank stress tests, remain.

All the trillions of dollars of federal corona-virus money to support income and jobs will require new bureaucracies to oversee disbursement of the funds. But once the money has been released and spent, what will happen to all those government agencies? If history is any guide, they and their constituents will come up with some rationale for the continued need for their functions.  

Furthermore, the power and reach of the federal government has been magnified greatly as the Federal Reserve, with its gigantic money-creating ability, has become, in effect, an arm of the Treasury Department. 


Its latest $2.3 trillion program lends directly to states, cities and mid-size businesses and even supports previously investment-grade corporate bonds that are now junk-rated.

 The central bank’s portfolio of assets, $4.2 trillion in February and now $6 trillion, may be headed for $10 trillion, or almost half of GDP. And the Treasury will cover $635 billion in bad Fed loans.


DYI:  As Boomers retire their savings just don’t slow down they come to a complete stop as year after year the excess savings glut that drove down interest rates since 1981 till today is in the process of ending forcing the Fed’s to step in to shore up the disappearing savings.  Interest rates are in the final stage of decline mostly due to the Corona-hoax insane lockdown smashing the economy.  Rates could bottom with the 10 year Treasury bonds going negative.  However, maintaining that level for interest rates will increase exponentially as treasury borrowings continue to leap ever higher eventually driving interest rates skyward in order to seek out buyers of our debt.  In a nutshell what you are seeing is the last hurrah bond market rally of a lifetime! 
 Interest Rates | JustThinking.us
As of 5/22/20
10 year T-Bond
0.68% 
The labor participation rate for working-age American males has fallen steadily since World War II, in part because many find disability and other government payments more attractive than gainful employment. This has contributed to the slow growth in productivity and the economy, especially in the last decade. The likelihood that the corona-virus pandemic’s income supplements will persist beyond the recession implies that these trends will accelerate. The resulting slow growth in corporate profits will be a drag on post-recession stock prices.

DYI:  Slowing the growth of corporate profits coupled with insane valuations is a prescription for lower and lower stock prices.  This decline will be in the years of its making a torturous adventure for the buy and hold stock market investor. 
Updated Monthly

AGGRESSIVE PORTFOLIO - ACTIVE ALLOCATION - 5/1/20

Active Allocation Bands (excluding cash) 0% to 50%
62% - Cash -Short Term Bond Index - VBIRX
38% -Gold- Global Capital Cycles Fund - VGPMX **
 0% -Lt. Bonds- Long Term Bond Index - VBLTX
 0% -Stocks- Total Stock Market Index - VTSAX
[See Disclaimer]
** Vanguard's Global Capital Cycles Fund maintains 25%+ in precious metal equities the remainder are domestic or international companies they believe will perform well during times of world wide stress or economic declines.  

 This blog site is not a registered financial advisor, broker or securities dealer and The Dividend Yield Investor is not responsible for what you do with your money.
This site strives for the highest standards of accuracy; however ERRORS AND OMISSIONS ARE ACCEPTED!
The Dividend Yield Investor is a blog site for entertainment and educational purposes ONLY.
The Dividend Yield Investor shall not be held liable for any loss and/or damages from the information herein.
Use this site at your own risk.

PAST PERFORMANCE IS NO GUARANTEE OF FUTURE RESULTS.
DYI

Wednesday, May 20, 2020

Grizzly Stops Attacking Cody Man After Accidentally Biting Can of ...

Amygdalotomy: Surviving the Intentional Demolition of Warning Signs

John P. Hussman, Ph.D.
President, Hussman Investment Trust

May 2020

Market lows associated with U.S. recessions have generally occurred at valuations that were about 40% of those prevailing today – and sometimes even less.
DYI:  Wow!  40% of the current Shiller PE at 27.65 x .4 = 11.06 Shiller PE.  Here at DYI I’m one hell of a bear and have been advocating low valuations after two or more market cycles such as experienced from 1966 to 1982.  I’m the first to always say anything is possible but all at once is a bit hard to swallow even for this major bear.  Let’s move on.     
If investors assume that valuations will never again approach historical norms, they must also accept that future investment returns will be dismal compared to historical norms. To say that “low interest rates justify high valuations in stocks” is also to say “low interest rates justify low future returns in stocks.” 
If one wishes to protect overvalued prices, one also has to accept meager long-term returns.
DYI:  That is correct if you assume permanent high valuations then investors better factor in permanent low future returns.  You’ll be anticipating real [after inflation] average annual returns around 1 to 2 percent per year.  Try factoring in how much you would need to retire with those sub atomic low numbers. One hell of a scary thought!
Investors should be careful to avoid the misconception that easy money always supports the market. The fact is that market outcomes are conditional on whether investor psychology is inclined toward speculation or toward risk aversion. This is best inferred directly from the uniformity or divergence of market internals. Despite the fact that the Fed eased the whole way down during the 2000-2002 and 2007-2009 collapses, investors have come to believe that Fed easing always supports stock prices. That’s the wrong lesson, and the re-education of investors is likely to be excruciating.
DYI:  Once the crowd decides to sell – no matter how much the Feds goose the money supply – they will be actively seeking buyers who will demand lower prices.  With the elites and their small army of technocrats around 10% of the U.S. adult population now own 84% of all American equities when they attempt to sell the only way the bottom 90% will be able to afford to buy is at substantially lower prices.  Only till that day arrives stocks will become the hot potato trading lower and lower among the 10%! 
In my view, by aggressively intervening in the financial markets, at valuation levels that are still nowhere near run-of-the-mill historical norms, the Federal Reserve has performed an amygdalotomy on the investing public. The Fed has encouraged a maladaptive confidence that risk does not exist. This overconfidence of investors is itself a threat to their survival. 

Shiller PE Ratio Signals Dangerously Overvalued Levels for Stocks
As of 2/19/20
27.36
In recent weeks, despite employment and economic dislocations that now have the Great Depression as their only precedent, the S&P 500 has advanced to valuations that are within 13% of the most extreme levels in history, including 1929, on measures best correlated with actual subsequent 10-12 year market returns. Meanwhile, the total returns of largest junk-debt ETFs have rebounded within 6% of record extremes.
 Emboldened by years of “buy the dip” reflex, and despite underlying risk-aversion, investors have found it impossible to resist taking one more bite at the apple. This enthusiasm reflects peak “the Fed has my back” confidence, at valuations that again imply negative S&P 500 10-year total returns, and despite market internals that remain more consistent with an overbought bear-market clearing rally than a sustained shift from risk-aversion.
DYI:  In a nut shell this is nothing more than classic bear market rally.  Once it is completed then you will see the real panic set in!
Q Ratio and the Market

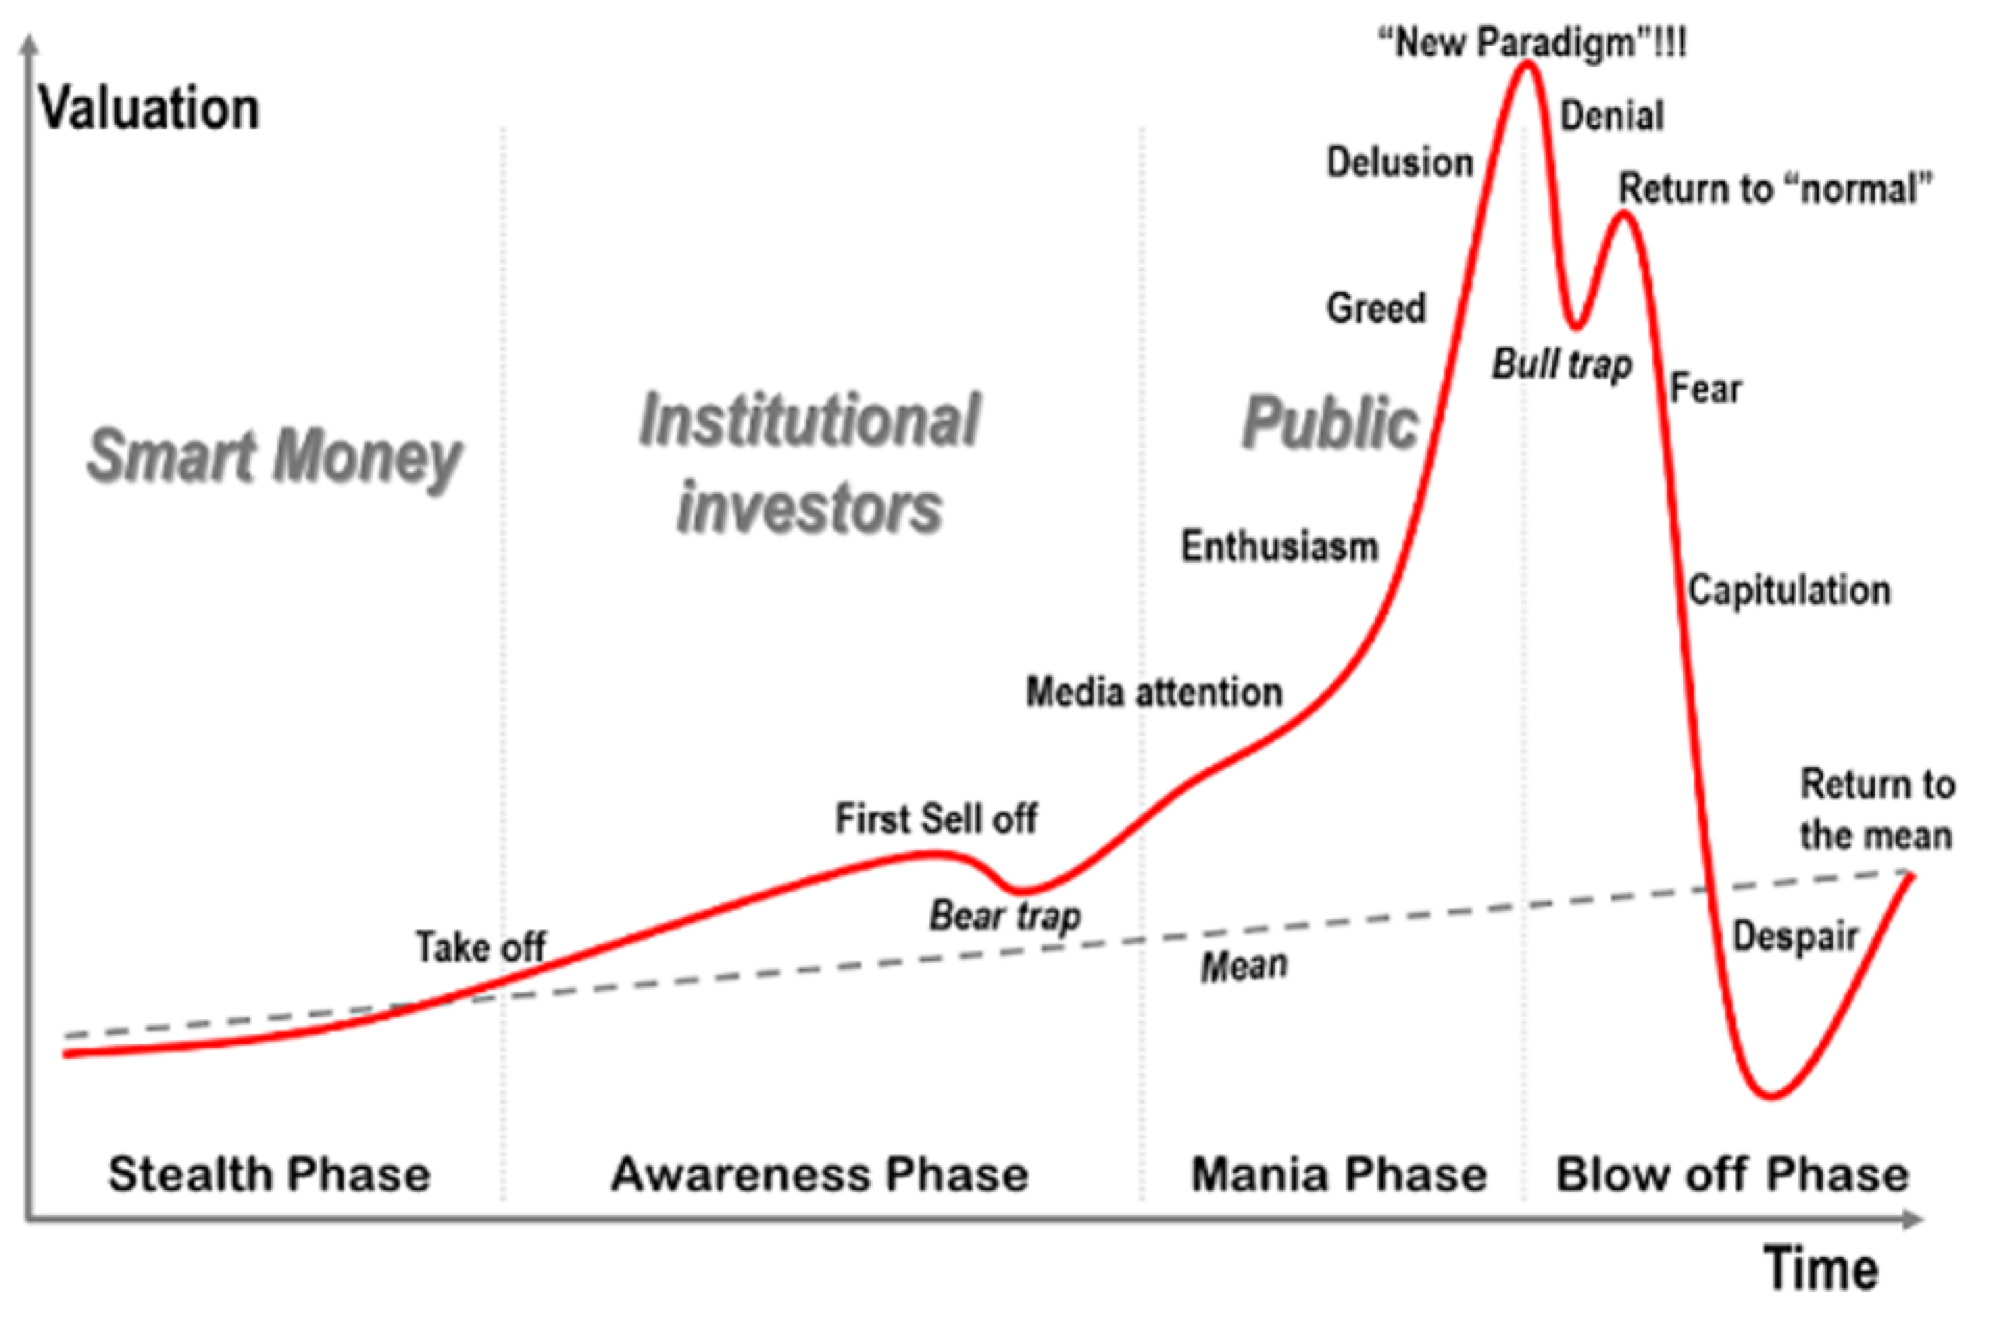
DYI:  The above chart showing the regression line stocks historically trade below 2/3’s of the time.  The remaining one third is the blow off stage due to massive overvaluation of equities.  Except for a brief period [2009 downturn] stocks have been massively elevated since the mid 1990’s.
There’s no question investors are looking “over the valley” in expectation of a “V” shaped recovery, and they are already chasing stocks, because recession lows are typically followed by bull markets. In that context, it’s worth remembering that market lows associated with U.S. recessions have generally occurred at valuations that were about 40% of those prevailing today – and sometimes even less. 
So yes, once the S&P 500 is down 60% or more, it will probably be reasonable to look “over the valley.”
That’s why the total return of the S&P 500 (nominal, including dividends) since March 2000 has averaged just 5.2% annually, 
despite the recent market advance to the most extreme valuations in history. Conversely, it’s also why normal or below-average valuations have historically been associated strong long-term returns.
 Real Gains
DYI:  If you had invested a lump sum [see above chart] in March of 2000 notice how long it would be before real after inflation returns were achieved.  Or dollar cost averaging is nothing more than small lump sums – such as 401k’s bi-monthly deposits – those made at high valuations will lower the participants overall return.  
With regard to the current downturn, I expect that over the completion of this cycle, the S&P 500 will most likely lose roughly two-thirds of its value as measured from the February 2020 highs. 
Even that retreat would only bring the S&P 500 to historically pedestrian, run-of-the-mill valuations.
DYI:  If you go to money chimp’s forecasting calculator putting in Shiller PE at 27.83 with a current dividend yield of 2.00% go to sleep like Rip Van Winkle awake 10 years from now your average annual estimated rate of return is 1.35%!  Of course most 401k’s charge 1.00% annual management fees plus trading impact costs around 0.50% AND inflation most likely around 2% or more.  Add those all up that’s 3.50% drag on your return.  Or in nut shell buying or holding stocks on a wholesale basis [generalized equity fund] is a terrible time to invest. 

Hold onto your hats and cash better values are ahead.
 Updated Monthly

AGGRESSIVE PORTFOLIO - ACTIVE ALLOCATION - 5/1/20

Active Allocation Bands (excluding cash) 0% to 50%
62% - Cash -Short Term Bond Index - VBIRX
38% -Gold- Global Capital Cycles Fund - VGPMX **
 0% -Lt. Bonds- Long Term Bond Index - VBLTX
 0% -Stocks- Total Stock Market Index - VTSAX
[See Disclaimer]
** Vanguard's Global Capital Cycles Fund maintains 25%+ in precious metal equities the remainder are domestic or international companies they believe will perform well during times of world wide stress or economic declines.  

 This blog site is not a registered financial advisor, broker or securities dealer and The Dividend Yield Investor is not responsible for what you do with your money.
This site strives for the highest standards of accuracy; however ERRORS AND OMISSIONS ARE ACCEPTED!
The Dividend Yield Investor is a blog site for entertainment and educational purposes ONLY.
The Dividend Yield Investor shall not be held liable for any loss and/or damages from the information herein.
Use this site at your own risk.

PAST PERFORMANCE IS NO GUARANTEE OF FUTURE RESULTS.
DYI

Thursday, May 14, 2020

“A recurring feature of a bursting investment bubble is the culmination of absurd statements and assertions by an otherwise seemingly reasonable individuals right around the parabolic top of such phenomena.”

“At the parabolic top of every financial bubble, thrilled investors lose their tether to
reality, and as the price of the speculative instrument rallies ever higher, investors’
expectations for additional price appreciation inflate ever more. 

Whether its Cisco Systems at a trillion-dollar market value, Qualcomm at $1000 a share, Oil at $200 a barrel, Bitcoin at a million dollar a piece, or Tesla at $7000 a share, these far fetched price fantasies are the fuel with which bubbles, and their beneficiaries, attempt to sustain themselves."
Nawar Alsaadi

A Hopelessly Corrupt Financial System Plus Historic Bubbles – Got Gold?

Wealth concentration returning to 'levels last seen during the ...

The Fed Is Fueling a Revolt That It Cannot Control

Under the tender care of the Federal Reserve, America's wealth inequality has skyrocketed to new heights of obscenity as America's billionaires feasted off the Fed's recent stock market rally. 

The driver of this fantastic concentration of private wealth is the stock market, the vast majority of which is owned by the top 10% (85%). Within this top 10%, the ownership of stocks, junk bonds, business equity and rental real estate is highly concentrated: the top 5% own roughly two-third's of America's private-sector wealth, the top 1% own 40% and the top 0.1% own 20%.

New York Times
A whopping 84 percent of all stocks owned by Americans belong to the wealthiest 10 percent of households. And that includes everyone’s stakes in pension plans, 401(k)’s and individual retirement accounts, as well as trust funds, mutual funds and college savings programs like 529 plans.
 It's not that hard to forecast a populist revolt against the parasitic class that's grown obscenely wealthy as a direct result of Fed policies while millions lose their jobs and what little financial security they once held. The common-sense demand would be: No more bailouts of Wall Street, which includes the big banks, the financiers, the corporations buying back $5 trillion of their own stocks to enrich the few at the top, and the corporations kept afloat with junk bonds and other financial trickery funded by the Fed.

Fred's Intelligent Bear Site brought to you by Fred Filskov. Public, private, and commercial distribution of this material is permitted as long as a link to this site is attached.

DYI:  What to expect with a federal Reserve willing to do anything to maintain these insane stock market valuation.  My guess is a 20 year redo from the mid 1960’s till the early 1980’s. Above is an inflation corrected stock chart for the Dow Jones Industrial Average is a grinding down of stock prices as happened in the time period just mentioned.  The Fed’s and fiscal stimulus will fight the decline creating a few large percentage bear rallies.  Never-the-less valuations will eventually drop to under 10 as measured by Shiller PE with dividends yields north of 5%!
Updated Monthly

AGGRESSIVE PORTFOLIO - ACTIVE ALLOCATION - 5/1/20

Active Allocation Bands (excluding cash) 0% to 50%
62% - Cash -Short Term Bond Index - VBIRX
38% -Gold- Global Capital Cycles Fund - VGPMX **
 0% -Lt. Bonds- Long Term Bond Index - VBLTX
 0% -Stocks- Total Stock Market Index - VTSAX
[See Disclaimer]
** Vanguard's Global Capital Cycles Fund maintains 25%+ in precious metal equities the remainder are domestic or international companies they believe will perform well during times of world wide stress or economic declines.  

 This blog site is not a registered financial advisor, broker or securities dealer and The Dividend Yield Investor is not responsible for what you do with your money.
This site strives for the highest standards of accuracy; however ERRORS AND OMISSIONS ARE ACCEPTED!
The Dividend Yield Investor is a blog site for entertainment and educational purposes ONLY.
The Dividend Yield Investor shall not be held liable for any loss and/or damages from the information herein.
Use this site at your own risk.

PAST PERFORMANCE IS NO GUARANTEE OF FUTURE RESULTS.
Till Next Time

DYI   


Thursday, May 7, 2020


The Bear’s job is to suck in as many investors to ride stocks all way to the bottom! 

Kenneth E. Royer – Dividend Yield Investor. 

 Bitcoin May Be Following This Classic Bubble Stages Chart — Steemit
Cantor Fitzgerald on the Stock Market Rally:


We continue to suggest the rally this week was due to market participants smoking hopium.  One of the five silliest rallies we’ve seen in our careers. That is exactly how a bear trap feels. We continue to believe it is time to aggressively hedge equity portfolios. To be fair, this has been our suggestion for the past week. Yesterday’s market action was emblematic disconnect for equity markets from any kind of reality – not just a fundamental one. In a world in which central banks distort risk and prevent price discovery, we understand that the markets and the economy are distinct.

18 Signs That We Are Facing A Record Breaking Economic Implosion In 2020