Thursday, April 30, 2020

Updated Monthly

AGGRESSIVE PORTFOLIO - ACTIVE ALLOCATION - 5/1/20

Active Allocation Bands (excluding cash) 0% to 50%
62% - Cash -Short Term Bond Index - VBIRX
38% -Gold- Global Capital Cycles Fund - VGPMX **
 0% -Lt. Bonds- Long Term Bond Index - VBLTX
 0% -Stocks- Total Stock Market Index - VTSAX
[See Disclaimer]
** Vanguard's Global Capital Cycles Fund maintains 25%+ in precious metal equities the remainder are domestic or international companies they believe will perform well during times of world wide stress or economic declines.  

 This blog site is not a registered financial advisor, broker or securities dealer and The Dividend Yield Investor is not responsible for what you do with your money.
This site strives for the highest standards of accuracy; however ERRORS AND OMISSIONS ARE ACCEPTED!
The Dividend Yield Investor is a blog site for entertainment and educational purposes ONLY.
The Dividend Yield Investor shall not be held liable for any loss and/or damages from the information herein.
Use this site at your own risk.

PAST PERFORMANCE IS NO GUARANTEE OF FUTURE RESULTS.
%
Stock & Bonds
Allocation Formula
5-1-20
Updated Monthly

% Allocation = 100 – [100 x (Current PE10 – Avg. PE10 / 4)  /  (Avg.PE10 x 2 – Avg. PE10 / 2)]


% Stock Allocation  8% (rounded)
% Bond Allocation  92% (rounded) 

Logic behind this approach:
--As the stock market becomes more expensive, a conservative investor's stock allocation should go down. The rationale recognizes the reduced expected future returns for stocks, and the increasing risk. 
--The formula acknowledges the increased likelihood of the market falling from current levels based on historical valuation levels and regression to the mean, rather than from volatility. Many agree this is the key to value investing.  
Please note there is controversy regarding the divisor (Avg. PE10).  The average since 1881 as reported by Multpl.com is 16.70.  However, Larry Swedroe and others believe that using a revised Shiller P/E mean of 19.6 , the number since 1960 ( a 53-year period), reflects more modern accounting procedures.


DYI adheres to the long view where over time the legacy (prior 1959) values will be absorbed into the average.  Also it can be said with just as much vigor the last 25 years corporate America has been noted for accounting irregularities.  So....If you use the higher or lower number, or average them, you'll be within the guide posts of value.

Please note:  I changed the formula when the Shiller PE10 is trading at it's mean stocks and bonds will be at 50% - 50% representing Ben Graham's Defensive investor starting point; only deviating from that norm as valuations rise or fall.        
  
DYI


This blog site is not a registered financial advisor, broker or securities dealer and The Dividend Yield Investor is not responsible for what you do with your money.
This site strives for the highest standards of accuracy; however ERRORS AND OMISSIONS ARE ACCEPTED!
The Dividend Yield Investor is a blog site for entertainment and educational purposes ONLY.
The Dividend Yield Investor shall not be held liable for any loss and/or damages from the information herein.
Use this site at your own risk.

PAST PERFORMANCE IS NO GUARANTEE OF FUTURE RESULTS.

The Formula.
Margin of Safety!

Central Concept of Investment for the purchase of Common Stocks.
"The danger to investors lies in concentrating their purchases in the upper levels of the market..."

Stocks compared to bonds:
Earnings Yield Coverage Ratio - [EYC Ratio]

EYC Ratio = 1/PE10 x 100 x 1.1 / Bond Rate

1.75 plus: Safe for large lump sums & DCA

1.30 plus: Safe for DCA

1.29 or less: Mid-Point - Hold stocks and purchase bonds.

1.00 or less: Sell stocks - Purchase Bonds

Current EYC Ratio: 1.51(rounded)
As of  5-1-20
Updated Monthly

PE10 as report by Multpl.com
DCA is Dollar Cost Averaging.
Lump Sum any amount greater than yearly salary.

PE10  ..........27.27
Bond Rate...2.67%

Over a ten-year period the typical excess of stock earnings power over bond interest may aggregate 4/3 of the price paid. This figure is sufficient to provide a very real margin of safety--which, under favorable conditions, will prevent or minimize a loss......If the purchases are made at the average level of the market over a span of years, the prices paid should carry with them assurance of an adequate margin of safety.  The danger to investors lies in concentrating their purchases in the upper levels of the market.....

Common Sense Investing:
The Papers of Benjamin Graham
Benjamin Graham

Monday, April 27, 2020

How to Invest in Gold Coins? Investing Money in Gold Bullion

Since Inception the Euro Has Devalued by 85% Against Gold

Since Inception the Euro Has Devalued by 85% Against Gold

Technically, the euro was launched on January 1, 1999, although euro notes and coins started circulating in January of 2002. The first gold price recorded in 1999 was €7,879 euros per Kg—or €7.88 euros per gram (we’ll use euros per gram as the gold price in the remainder of this article). By now, the gold price has crossed €51 euros per gram. A new all-time high.

DYI:  At this rate of decline one can only wonder how much longer the single currency union will survive.  Gold and silver purchases for those living in the EU have escalated at an ever increasing pace since the union began back in 1999.  Now with the Corona Hoax going full steam gold and silver sales to the public has resulted in spot shortages along with the public ever increasing knowledge their Euro is being debased at an ever increasingly rate.  I wish those people well and much luck they are going to need all they can get.   

Till Next Time

DYI

Wednesday, April 22, 2020

This bounce off the bottom is a bull trap!

Does Pepper Spray Actually Work Against Bears? | Time

Even at the market lows a few weeks ago, the S&P 500 was down just 34% from its highest level in history, and remained at valuations that were 2.3 times their historical norms. 

Bitcoin May Be Following This Classic Bubble Stages Chart — Steemit
 As Ben Hunt of Epsilon Theory observed last week, “This is the Greenspan-Bernanke-Yellen legacy: a financialized political economy where the preservation of asset prices is our government’s primary objective.”
DYI:  This stock market decline whether induced by the Corona-hoax* or simply a house of cards that fell due to massive overvaluation was going to happen sooner than later.  Valuations remain obscenely high with 10 year average annual estimate returnof 2.37% with dividends reinvested.  Not much to write home about and certainly not a wealth builder return!  This bear cycle is not finished as there will be more downside to come over the following weeks.  However as I have noted there is one bright spot with the oil and gas industry in the bargain territory!

*Please go to 153news.net their videos are not censored showing conclusively that what you are seeing in the propaganda spewing main stream press does not line up with what is actually going on.

Till Next Time
DYI    

Friday, April 17, 2020

Oil
Price Smash!
Oil Rig Dangers: Work-Related Fatalities and Safety | SDS Blog
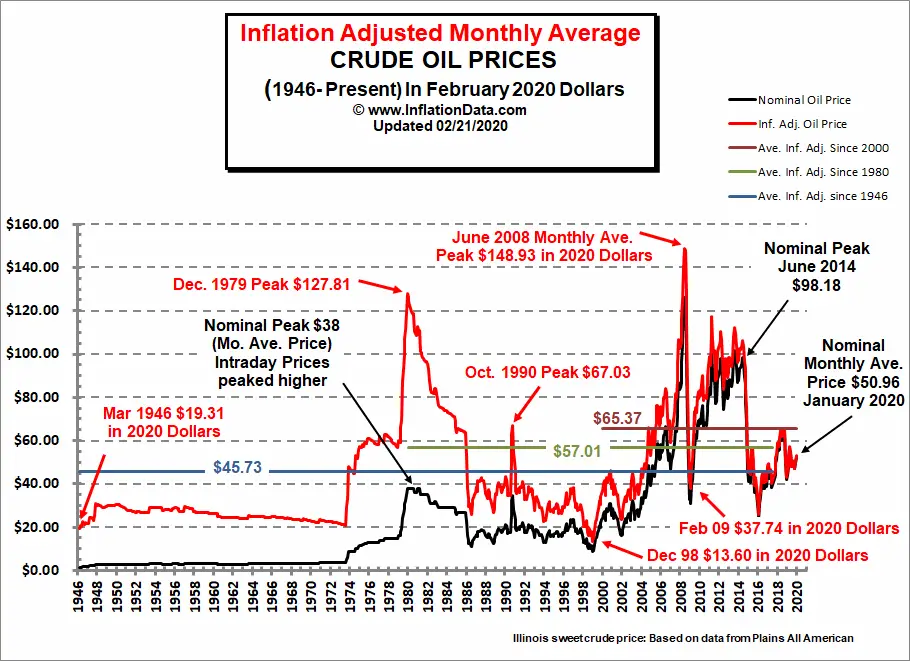
Oil is the poster child of the forces driving massive deflation: overcapacity / oversupply and a collapse in demand. Overcapacity / oversupply and a collapse in demand are not limited to the crude oil market; rather, they are the dominant realities in the global economy.

DYI:  Oil as measured by West Texas Intermediate as I’m writing this post 9:22 A.M. 4/17/20 is trading at $17.51!  As compared to 5 years ago at $55.74 prices from that time till now has dropped by a staggering 69%!  If oil prices go single digits [I have no idea if they will or won’t] then oil and gas shares will be at “the give-away-table.”  Prices when corrected for inflation will be far cheaper than the 1998 price smash.
Historical Oil Prices Chart
As of 4/17/20
$17.51
For those of you with 401k’s that have an oil/gas energy sector funds this is a great time to dollar cost average at very low prices.  Recovery for oil prices may take months especially if the U.S. experiences a deflationary smash.  That is great as that will allow you time to build a position with some size.  My favorite of course is Vanguard’s Energy Fund symbol VGENX current 6.42% yield. 

You will know that you are close to the bottom when see headlines almost daily discussing the demise of the oil and gas industry.  Below is such an example.

Why oil prices will never recover

Disclaimer

This blog site is not a registered financial advisor, broker or securities dealer and The Dividend Yield Investor is not responsible for what you do with your money.
This site strives for the highest standards of accuracy; however ERRORS AND OMISSIONS ARE ACCEPTED!
The Dividend Yield Investor is a blog site for entertainment and educational purposes ONLY.
The Dividend Yield Investor shall not be held liable for any loss and/or damages from the information herein.
Use this site at your own risk.

PAST PERFORMANCE IS NO GUARANTEE OF FUTURE RESULTS.
DYI

Thursday, April 16, 2020

Inflation Corrected Prices
Oil is as Cheap as the Late 1990’s
Historical Oil Prices Chart
As of 4/16/20
$20.14

U.S. Oil Crashes Below $20 On Record Demand Plunge

WTI Crude prices tumbled early on Wednesday to below $20 a barrel, after the International Energy Agency warned of a record oil demand slump this year, adding additional bearish tilt to the market which is already digesting huge U.S. inventory builds and too-little-too-late OPEC++ actions to support prices.  

DYI:  Oil and gas stocks have been hit extremely hard with a sell off of nearly 50% on average.  Panics are a great time to go bargain hunting as West Texas Intermediate price per barrel has been dipping below $20!  Yields are excellent with DYI’s favorite Vanguard’s Energy symbol VGENX currently delivering 6.42% yield while waiting for energy prices to recover.  Obviously if oil price remain low for a longer than a year then dividends will be cut back, however, prices are now cheap as shown in the above chart.
DYI

Wednesday, April 15, 2020

The
HOAX


Charles Hugh Smith
****************************
“Like the rest of the financialization machine, sickcare was never sustainable. The pandemic is merely the catalyst that is stripping away the PR illusions that have cloaked the looting, the fraud, the racketeering and profiteering, and the betrayal of everything healthcare once stood for.”  Rice Farmer

DYI:  Neither Smith nor the news generator site Rice Farmer they are unwilling nor unknowingly to report that this is a World Health Organization DRILL being promoted as if it is real.  No different than all of the stage faked mass school shootings [or else where (Las Vegas)] were Department of Homeland DRILLS all promoted as real.  This HOAX has now gone almost world wide.  

Here is two links to go to for far more in depth covering this hoax.  The firsts is for videos; 153news.net does not censor you will find the TRUTHER’S [citizen journalist) videos.  Jeffersonian Girl or The Voice of Reason (and so many others) are exceptional.  The second is Miles Mathis (and a few guest writers) is in the written format busting these current and decades past hoaxes all designed to steal massively from world wide treasuries.


DYI

Tuesday, April 14, 2020

What you are seeing is a rally for stocks all within a continuing bear market. Earmarked by being FAST, FURIOUS, and then FAIL!

“The fictitious valuation of the stock market will eventually re-connect with reality in a violent decline.”
“The fiction that the Fed is all-powerful is the Emperor's new clothes; no one dares mention the emperor is buck-naked and the Fed cannot keep stocks separated from reality forever.”
Charles Hugh Smith

Buy The Tumor, Sell the News


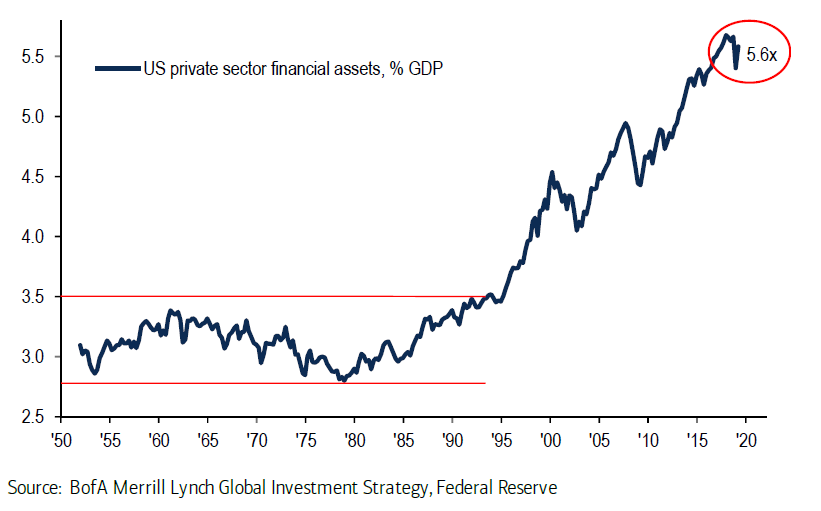
US financial assets now 5.6 times GDP | The Market Ear
The system's total dependence on asset bubbles in stocks and housing to generate the "wealth effect" that drives consumption defines Fed policy, along with the need to keep stock-dependent pension funds and liquidity-dependent zombie corporations solvent.

That the Fed's pimping of asset bubbles and liquidity has created the greatest wealth inequality in a century is ignored by the self-serving, tone-deaf political/financial "leadership" because the wealth asymmetry has greatly enriched the "leaders," their cronies and the army of technocrat flunkies who do all the real work to keep the rackets functioning.
All this wealth wasn't earned via the creation of value; it was skimmed / embezzled from the bottom 95% via high costs, junk fees, penalties, interest rates and taxes, all set by monopolies and cartels unburdened by competition, accountability or transparency.

SOCIETE GENERALE: Stocks are riding a fleeting rally before fundamentals collapse and 'the real bear market begins'

  • Major US indexes recently rebounded into bull-market territory. But precedent suggests stocks will fall further as the US slides into a lengthy recession, Societe Generale said in a Thursday note.

  • The stock market is in the middle of a brief bear-market bounce mirroring gains made in October 2008 before the financial crisis pulled equities down another 25%, the strategist and longtime bear Albert Edwards said.

  • Downward pressure from low inflation and a near-term recession stand to make the virus-induced profit slump deeper than past declines, he added.

  • Many investors are poised to reenter the market "only to be crushed as history suggests is normal," Edwards wrote.
"It is a big ask to expect investors to try to look through these events and shrug them off — perhaps more so for negative prints of core [consumer price index] than a profits slump," Edwards wrote, adding that negative 10-year Treasury yields may be on the horizon as investors flock to safer assets.
10-year Yield Log Scale
Yield as of 4/13/20
0.74%

Saturday, April 11, 2020


Excess Money Supply Has Been Like Miracle-Gro for Gold Prices ...

Excess Money Supply Has Been Like Miracle-Gro For Gold Prices

The $2.2 trillion coronavirus [hoax] relief package that President Donald Trump signed into law on March 27 is just the beginning. The Treasury Department is now seeking some $250 billion more to replenish small business loans, and there’s hope that the president and House Democrats can agree on a “Phase Four” spending deal, one that may target infrastructure. Trump has asked for $2 trillion.
According to Evercore ISI’s Ed Hyman, as many as 285 stimulus measures have been announced around the world in the past eight months, “the most ever by a wide margin.” Japan, which only this week declared a state of emergency, approved a $1 trillion relief package on Tuesday.
Last month I predicted that at least $10 trillion would be spent to mitigate the economic impact of this virus, and it appears as though we’re already there, with much more to go. And this is all before considering monetary stimulus in the form of near-zero rates and quantitative easing (QE).
Gold touched its all-time high of $1,900 an ounce in 2011 when M2 money supply growth soared above 10 percent year-over-year. With supply growth now at 12 percent––and likely headed higher––liquidity has flowed into physical gold as well as paper gold. On Monday, spot gold traded above $1,700 for the first time since December 2012. The next test, I believe, is $2,000, and as I’ve said before, $10,000 gold isn’t crazy.
DYI

Friday, April 10, 2020

Gold
Rallies!

Gold Blasts Through $1500: Message? Central Banks Out of Control ...

Gold price spikes higher after Federal Reserve announces $2.3 trillion in loan program

Price of Gold
Gold Bottoms
December 16, 2015
$1050 
Thursday, the U.S. central bank said that it would provide up to $2.3 trillion dollars in loans for all businesses impacted by the growing COVID-19 pandemic hoax.
“Our country's highest priority must be to address this public health crisis hoax, providing care for the ill and limiting the further spread of the virus," said Federal Reserve Board Chair Jerome H. Powell said in a statement.
"The Fed's role is to provide as much relief and stability as we can during this period of constrained economic activity, and our actions today will help ensure that the eventual recovery is as vigorous as possible,” he added.
Gold prices have shot higher in reaction to the latest central bank announcement. June gold futures last traded at $1,722.80 an ounce, up more than 2% on the day.
Commodity analysts have said previously that they can’t be anything but bullish on gold as governments and central banks around the world flood financial markets with liquidity.
“The massive infusion of money into the U.S. financial system cannot help but produce worrisome price inflation down the road. It’s likely the smart-money metals traders have realized this and are buying those hard assets as an inflation hedge,” he said.
He added that it’s not just the U.S. Japan’s central bank is putting together another major package and with European politicians unable to agree on stimulus measures it will the responsibility of supporting the regional economy will fall to the European Central Bank.

U.S. GDP will contract 30% in second quarter, 5% in 2020: PIMCO

The 30% contraction in growth in the second quarter would likely be followed by two quarters of recovery, Wilding wrote. While two quarters of contraction is shorter than the four recorded in the 2008 financial crisis, the depth of the shock is far greater - quarterly contractions did not rise above 8% during that time.
Updated Monthly

AGGRESSIVE PORTFOLIO - ACTIVE ALLOCATION - 4/1/20


Active Allocation Bands (excluding cash) 0% to 50%
65% - Cash -Short Term Bond Index - VBIRX
35% -Gold- Global Capital Cycles Fund - VGPMX **
 0% -Lt. Bonds- Long Term Bond Index - VBLTX
 0% -Stocks- Total Stock Market Index - VTSAX
[See Disclaimer]
** Vanguard's Global Capital Cycles Fund maintains 25%+ in precious metal equities the remainder are companies they believe will perform well during times of world wide stress or economic declines.  

 This blog site is not a registered financial advisor, broker or securities dealer and The Dividend Yield Investor is not responsible for what you do with your money.
This site strives for the highest standards of accuracy; however ERRORS AND OMISSIONS ARE ACCEPTED!
The Dividend Yield Investor is a blog site for entertainment and educational purposes ONLY.
The Dividend Yield Investor shall not be held liable for any loss and/or damages from the information herein.
Use this site at your own risk.

PAST PERFORMANCE IS NO GUARANTEE OF FUTURE RESULTS.
DYI

Saturday, April 4, 2020

Vanguard
 High Yield Corporate Bond Fund
Current Yield 8.06%
*********************
Vanguard
Energy Fund
Current Yield 6.42%
DYI:  Two different sectors have been beaten down significantly showing excellent future returns for the long term investor.  They are Vanguard’s High Yield Corporate Bond Fund symbol VWEHX and Vanguard’s Energy Fund symbol VGENX.  The High yield fund current yield is [as of 4/3/20] 8.06% with an effective yield to maturity of 4 years in length.  Compared to 5 year T-notes at 0.39% you now have excellent interest rate coverage for your risk.  The energy fund’s dividend yield is now [as of 4/3/20] 6.42%.  Obviously if oil prices stay low for an extended time such as a year or more there will be dividend reductions.  Be as that may be this sector has been smashed making for a great buying opportunity at depressed prices.

Till Next Time
DYI

Disclaimer

This blog site is not a registered financial advisor, broker or securities dealer and The Dividend Yield Investor is not responsible for what you do with your money.
This site strives for the highest standards of accuracy; however ERRORS AND OMISSIONS ARE ACCEPTED!
The Dividend Yield Investor is a blog site for entertainment and educational purposes ONLY.
The Dividend Yield Investor shall not be held liable for any loss and/or damages from the information herein.
Use this site at your own risk.

PAST PERFORMANCE IS NO GUARANTEE OF FUTURE RESULTS.
Thursday, April 2, 2020

Have Utilities Peak?

DYI:  Utility stocks have been a favorite investment for conservative and aggressive investor alike.  Since interest rates top out way back in 1981 enlighten investors bought utilities for their income or capital gains.  In the end both types of investor had the best of both worlds!  Of course that was then this is now.  Despite the big drop in yields the Dow Jones Utility index is down 20.2% from one year ago.  Notice how utilities are only lagging gold since the year 2000 the beginning of our valuations based secular bear market?  Are we seeing the top for utilities?  An investor must always be on guard not to overstay a winning trade.     
Till Next Time
4-1-20
Updated Monthly

Secular Market Top - Since January 2000

+  88.2% Dow       
+158.6% Transports 
+167.8% Utilities

+ 73.0%  S&P 500
+ 84.4%  Nasdaq

+ 79.5%  30yr Treasury Bond

+461.1% Gold
  - 16.0% Oil
  +66.0% Swiss Franc's
    
From High to Low - Since Year 2000

+461.1% Gold
+167.8% Utilities
+158.6% Transports
+  88.2% Dow
+  84.4% Nasdaq
+  73.0S&P 500
+  79.5% 30yr Treasury Bonds
+  66.0% Swiss Franc's
-   16.0% Oil 

December 1999 Shiller PE10 was 44.19               
August 2000 S&P 500 dividend yield was 1.11%  

Shiller PE10 4-1-20 is 24.40
S&P 500 dividend yield 4-1-20 is 2.32%
[Shiller PE10 & dividend yield is reported using data from the beginning of the month when I update.  It may or may not exactly be the first trading day of the month.]


It is easily seen in the year 2000 the Nasdaq was horribly overvalued and gold was on the give away table, such lopsided returns 19 years later!
DYI

Wednesday, April 1, 2020

%
Stock & Bonds
Allocation Formula
4-1-20
Updated Monthly

% Allocation = 100 – [100 x (Current PE10 – Avg. PE10 / 4)  /  (Avg.PE10 x 2 – Avg. PE10 / 2)]


% Stock Allocation  19% (rounded)
% Bond Allocation  81% (rounded) 

Logic behind this approach:
--As the stock market becomes more expensive, a conservative investor's stock allocation should go down. The rationale recognizes the reduced expected future returns for stocks, and the increasing risk. 
--The formula acknowledges the increased likelihood of the market falling from current levels based on historical valuation levels and regression to the mean, rather than from volatility. Many agree this is the key to value investing.  
Please note there is controversy regarding the divisor (Avg. PE10).  The average since 1881 as reported by Multpl.com is 16.70.  However, Larry Swedroe and others believe that using a revised Shiller P/E mean of 19.6 , the number since 1960 ( a 53-year period), reflects more modern accounting procedures.


DYI adheres to the long view where over time the legacy (prior 1959) values will be absorbed into the average.  Also it can be said with just as much vigor the last 25 years corporate America has been noted for accounting irregularities.  So....If you use the higher or lower number, or average them, you'll be within the guide posts of value.

Please note:  I changed the formula when the Shiller PE10 is trading at it's mean stocks and bonds will be at 50% - 50% representing Ben Graham's Defensive investor starting point; only deviating from that norm as valuations rise or fall.        
  
DYI


This blog site is not a registered financial advisor, broker or securities dealer and The Dividend Yield Investor is not responsible for what you do with your money.
This site strives for the highest standards of accuracy; however ERRORS AND OMISSIONS ARE ACCEPTED!
The Dividend Yield Investor is a blog site for entertainment and educational purposes ONLY.
The Dividend Yield Investor shall not be held liable for any loss and/or damages from the information herein.
Use this site at your own risk.

PAST PERFORMANCE IS NO GUARANTEE OF FUTURE RESULTS.
The Formula.
DYI:  Despite the EYC Ratio giving the all clear to dollar cost average into stocks valuations remain very elevated it is best to concentrate your purchases into beat up areas of the market.  Oil/gas/service (drillers, pipeline companies etc.) and/or precious metals mining companies come to mind.  Or downside resistant stocks such as electricity, gas, water utilities or food producers will work as well.  If you are using mutual funds [such as your 401k] an equity income fund emphasizing dividend yield first then possible capital gain second will help protect on the downside and allow better compounding as compared to bonds.  DYI’s favorite as you might have guessed is Vanguard Equity Income Fund Investor Shares (VEIPX) current yield at 3.07%.
Good Hunting

Margin of Safety!

Central Concept of Investment for the purchase of Common Stocks.
"The danger to investors lies in concentrating their purchases in the upper levels of the market..."

Stocks compared to bonds:
Earnings Yield Coverage Ratio - [EYC Ratio]

EYC Ratio = 1/PE10 x 100 x 1.1 / Bond Rate

1.75 plus: Safe for large lump sums & DCA

1.30 plus: Safe for DCA

1.29 or less: Mid-Point - Hold stocks and purchase bonds.

1.00 or less: Sell stocks - Purchase Bonds

Current EYC Ratio: 1.54(rounded)
As of  4-1-20
Updated Monthly

PE10 as report by Multpl.com
DCA is Dollar Cost Averaging.
Lump Sum any amount greater than yearly salary.

PE10  ..........24.40
Bond Rate...2.93%

Over a ten-year period the typical excess of stock earnings power over bond interest may aggregate 4/3 of the price paid. This figure is sufficient to provide a very real margin of safety--which, under favorable conditions, will prevent or minimize a loss......If the purchases are made at the average level of the market over a span of years, the prices paid should carry with them assurance of an adequate margin of safety.  The danger to investors lies in concentrating their purchases in the upper levels of the market.....

Common Sense Investing:
The Papers of Benjamin Graham
Benjamin Graham