Wednesday, October 30, 2019

Bubble
News

Stock Market Crash Near? Nobel Laureate Sees 'Bubbles Everywhere'

"I see bubbles everywhere," Shiller, economics professor at Yale University and author of just-published "Narrative Economics" told investors gathered in Los Angeles on Oct. 23. "There's no place to go. You just have to ride it out. You invest even though you expect the price to decline." Shiller famously predicted the 2000 stock market crash and the 2007 crash of the housing market.
 DYI:  DYI doesn’t agree that there is no place to hide.  My model account is heavy in short term bills and notes plus holdings in precious metals. 
Updated Monthly

AGGRESSIVE PORTFOLIO - ACTIVE ALLOCATION - 10/1/19

Active Allocation Bands (excluding cash) 0% to 50%
71% - Cash -Short Term Bond Index - VBIRX
29% -Gold- Global Capital Cycles Fund - VGPMX **
 0% -Lt. Bonds- Long Term Bond Index - VBLTX
 0% -Stocks- Total Stock Market Index - VTSAX
[See Disclaimer]
**Tocqueville Gold Fund TGLDX is a pure play 100% junior gold mining gold fund.  Vanguard's Global Capital Cycles Fund maintains 25% in precious metal equities the remainder are companies they believe will perform well during times of world wide stress or economic declines. 
Shiller sees bubbles in the stock market, bond market and the housing market. "You get ... in a situation where you know it's going to decline, but you still saved enough to hold you over; you have no choice."
Shiller, who won the Nobel Prize in economics in 2013, told Investor's Business Daily he expects just 4.4% average annual returns in U.S. stocks over the next 30 years. That's a disappointing return expectation — less than half the market's long-term return and well short of what pensions are calling for. The S&P 500's long-term return is 9.84%, says Index Fund Advisors. 
Shiller: The 'Bond Market Boom Is Unsustainable' 
Shiller is as nervous about bonds as he is about U.S. stocks. Bonds continue to be one of the hottest asset classes going as investors seek the safety of income. The SPDR Portfolio Aggregate Bond ETF (SPAB) delivered a stock-like total return this year of 8.31%. That's more than twice its average annual return of 3.7% over the past 10 years. Investors are pouring money into bond ETFs, hoping to hide from stock-market volatility and get at least some return.
Shiller On Housing Bubble: "It's Just Like 2005 Again" 
Shiller says the housing market is in a bubble phase, not unlike 2005. That was the point the housing bubble was inflated, but yet to go parabolic. "It's like 2005 again," Shiller said. "San Francisco and L.A. are already slowing down." That's a "bad indicator," he said, as those markets have been going up for years.
Yet, given the housing bubble isn't as "excited as it was" in the early 2000s, Shiller has been reluctant to publicly call it a bubble until now. And he thinks enough people remember the 2000's housing bubble so they recall "home prices really do fall." We're not "as exuberant now, so I'm not sure it's a repeat performance," he said.
DYI:  
The yield is whatever the Fed committee decides it is. There is very limited liquidity in the Treasury market, and no price discovery going on at all.

Yes, a decade ago Treasuries was the most liquid market on the planet (by a long shot). But that is no longer the case.

Credit card rates continue to go UP, not down.

Even though car loans are "free" (0% financing etc.) -- the financing is actually built into the price, even for used cars. When was the last time a car ad displayed the actual price of the car, instead of lease / financing terms?

At least 80% of new mortgages now are underwritten by the federal government (FNMA, FHLMC, GNMA).... the rates are set by politicians who are desperate to keep home prices elevated (capital gains taxes, property taxes, bank bailout costs, etc.).

We all joke about Government Motors no longer being a private entity except on paper.

Its time to acknowledge the US Treasury market is mostly the US government on both sides of trades.

In the end Mr. Market will have his way and the bubble will pop with prices dropping most likely over a two year period with the Fed’s fighting the decline all the way to the bottom.  Of course no one knows when this will begin.  So hang onto hats and your cash and precious metals better values are ahead. 
 DYI


Monday, October 28, 2019

Image result for driverless vehicles pictures
Driverless Vehicles
Ready for Primetime?
The key to interpreting all these driverless vehicle announcements are: IF you can constrain and control a theater of operation sufficiently tightly, you can make it possible for robots to operate more efficiently than humans.  Exactly how tightly you have to control is evolving.  As sensors, processing and basic leaning algorithms improve, richer and more complex theaters, which were off limits before, now become possible. And simultaneously, as first hand experience grows, you'll get more confidence.

Eventually, someone will attempt extending the operating theater of drive bots, with commercial as opposed to pure pie-in-the-sky research intent: From closed mines to the most predictable corners of the public roads transportation network. More likely than not, moving to long haul trucking on the most predictable, hence least risky, stretches of freeway. When that happens, especially as soon as more than one group is doing it profitably and hence competition ensues, that will be a big step forward.

Then, the race will be on; slowly at first as the risk of real injury is great once you’re flinging objects around at freeway speeds, improvements will open up more stretches of roadway.
The takeaway is a much bigger step from "autonomous vehicles being viable somewhere" to "being viable anywhere."  

They're already viable in some specific mining sectors. That hurdle is already met. But that hurdle is also only the tiniest of baby steps of the way to the latter, which after all does include drive bots conducting themselves better than humans as drivers of police cruisers and others engaged in running gun battles through rush hour Manhattan.

Exactly how quickly the level of complexity increases as you move away from the most predictable of environments and into richer ones, is the central question of concern for those bent on a fully general deployment of drive bots into infrastructures fully shared with humans. No one has even the remotest idea how to estimate that yet.

But so far, in EVERY other attempt at AI: Early developments has proven easy, promising AND very impressive.  Then, they have ALL; fairly quickly hit a complexity wall so steep, almost any progress from the quick, "easy" early stages ends up being completely stymied. Until eventually all those involved get sufficiently frustrated, that they slink back to do something more rewarding with their Nobel laureate sized brains.

So, predicting when autonomous vehicles are viable doesn't really mean much, unless you specify the environments in which you posit viability. Do you mean in certain, tightly selected mining operations? Do you mean as pure research without even a concern about whether a certain scenario can be self funding? Do you mean commercially viable operation on 10% the total mileage of US freeways? Or do you mean running gun battles through Manhattan? The difference in years from the first to the last, could be 20 years. Or it could be 50 years or more. No one knows, and the history of previous flirtations with AI booms, certainly don't provide much grounds for optimism.
DYI

Sunday, October 27, 2019

Shop Until You Drop
Has Been Replaced By
Work Until You Drop

A World Without Retirement

The population is getting older and the welfare state can no longer keep up. After two months of talking to people in Britain [or the U.S.] about retirement, it’s clear that old age is an increasingly scary prospect.

We are entering the age of no retirement. The journey into that chilling reality is not a long one: the first generation who will experience it are now in their 40s and 50s. They grew up assuming they could expect the kind of retirement their parents enjoyed – stopping work in their mid-60s on a generous income, with time and good health enough to fulfil long-held dreams. For them, it may already be too late to make the changes necessary to retire at all.
This is what a world without retirement looks like. Workers will be unable to put down tools, even when they can barely hold them with hands gnarled by age-related arthritis. The raising of the state retirement age will create a new social inequality. Those living in areas in which the average life expectancy is lower than the state retirement age (south-east England has the highest average life expectancy, Scotland the lowest) will subsidize those better off by dying before they can claim the pension they have contributed to throughout their lives. In other words, wealthier people become beneficiaries of what remains of the welfare state.
Many now in their 20's will be unable to save throughout their youth and middle age because of increasingly casualized employment, student debt and rising property prices. By the time they are old, members of this new generation of poor pensioners are liable to be, on average, far worse off than the average poor pensioner today.

The Demographic Depression Will Overwhelm Central Bankers Over The Upcoming Decade

The decelerating growth and/or outright decline of the working age population is clearly visible in every part of the world. This article details where the deceleration began and the extent of the decelerations / declines. The reason this is so important is that the majority of economic growth is driven by the rising demand represented by the growth of the working age population (and their increasing quantity of employed persons). But not just the rise of any population, but those of means, those with savings, and those with access to credit.  This growth drives mega infrastructure projects, buildouts of supply chains, increased production, and ultimate rise in consumer demand. Absent that population growth (particularly among those with means) governments have been "building bridges to nowhere", "building ghost cities", providing "lower for longer", ZIRP, NIRP, and monetizing debt, etc. etc.  This is all ultimately a fools errand only worsening the ultimate reorganization. 
Why?  The working age populations earn and spend about double of those on fixed incomes among the elderly populations.  The working age populations are at full employment and little to no further growth in employment is possible (detailed, HERE).  Elderly utilize little to no credit and focus on paying off their debts...thus despite low rates, money velocity will keep on tanking.  The declining interest rates, rising debt, and ever greater centrally controlled markets are the flip-side of the charts I show below.  The below charts all show the ten year change of the 20 to 65 year old population (and percentage change in that working age population divided by total working age population) versus the same for the 65+ year old populations.  
DYI:  What is on the horizon is an upcoming deflationary smash similar to the Japanese experience.  Real Estate whether residential or commercial along with stocks will decline in value significantly.  Bond yields among high quality corporate's and government bonds will decline.  High yield/junk bonds many will go bust with yields moving up to fully relate to the risk.  The only reason asset prices have remained massively overvalued is due to world wide central bankers driving down interest rates.  A mild recession that I’m anticipating will produce negative interest rates going out with 3 to 5 year Treasury notes!

So hang onto hats and your cash and precious metals better values are ahead.
 DYI


Tuesday, October 22, 2019


The Fed Is Lying To Us

"When it becomes serious, you have to lie"
by Chris Martenson
Case in point: On October 4, Federal Reserve Chairman Jerome Powell publicly claimed the US economy is “in a good place”. Yet somehow, despite the US banking system already having approximately $1.5 trillion in reserves, the Fed is suddenly pumping in an additional $60 billion per month to keep things propped up. 
The Fed’s Rescue Was Never Real 
Remember, after a full decade of providing “emergency stimulus measures” the US Federal Reserve stopped its quantitative easing program (aka, printing money) a few years back. 
Mission Accomplished, it declared. We’ve saved the system. 
But that cessation was meaningless. Because the European Central Bank (ECB) stepped right in to take over the Fed’s stimulus baton and started aggressively growing its own balance sheet — keeping the global pool of new money growing.
DYI Quick Comment:  Around and around we go as the QE baton was handed off from one major central bank to another when it stops nobody knows?!
Every trick in the book has been used.  QE. Operation Twist. Jawboning by Bernanke, Yellen and now Powell. More jawboning and tweets from the President and his administration. And now, fresh interest rate cuts and a resumption of QE (but don’t call it that!) by the Fed. 
Collectively, these efforts have horsewhipped stocks and bonds higher and higher over the past decade — which was the intent. But it seems the higher they go (and thus further distorted from their underlying valuation fundamentals), the Fed becomes ever more frightened of a correction.

DYI Quick Comment II:  A mild recession – which I’m currently anticipating will cut the U.S. market by 50%!  You bet the central banks are scared!
The last rate hike was in January and the Fed is now back to lowering rates. With the federal funds rate at a measly 2.0% today and likely headed lower from here, the Fed has practically no wiggle room to speak of at this point:
DYI Quick Comment III:  The Fed’s has more room to cut and lots of it!  A mild recession the Fed’s will push out to 5 year or less Treasury bills/notes negative!

It’s no longer an issue of keeping stock prices attractively high. It’s about accelerating social inequality, the rejection of capitalism and globalization, rising geopolitical divisions, resource scarcity, and the loss of liberty, health and happiness. 
Central planners’ extractive policies are now manifesting in all of these ills.
 DYI:  In the end Mr. Market will have his way bringing back down to earth valuations for stocks and corporate bonds especially high yield/junk bonds.  So hold onto your hats and cash and precious metals better valuations are ahead.  
DYI

Monday, October 7, 2019

A mild recession I 'm anticipating will produce negative interest rates as far out as the 5 year T-note!

September 4, 2019 Friday the 30 year Treasury bond dipped below 2.00%!  The Fed’s are worried – and rightfully so – about an oncoming recession.  This of course is old news for readers of the Dividend Yield Investor.

Image result for 30 year Treasury bonds chart pictures
30 year Treasury bond yield closed 10-4-19
2.01%

Sunday, October 6, 2019

%
Gold/Silver
Allocation
10-1-19

Updated Monthly

100 – [100 x (Current GS – Avg. GS / 4)
_______________________________________

(Avg.GS x 2 – Avg. GS / 2)
[The formula's answer allocates gold percentage]

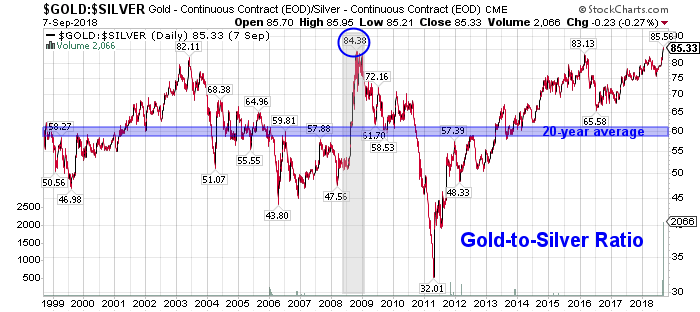
Current Gold/Silver Ratio 86

Average Gold/silver Ratio 50

Allocation:    
Gold       2%
Silver   98%
Image result for gold to silver ratio chart pictures
Average Gold/Silver Ratio since 1900
50 to 1
Gold and silver bullion buyers and traders use the fluctuating Gold Silver Ratio to better determine which precious metal may be poised to outperform the other.

The essence of trading the gold-silver ratio is to switch holdings when the ratio swings to historically determined extremes. So:

When a trader possesses one ounce of gold and the ratio rises to an unprecedented 100, the trader would sell their single gold ounce for 100 ounces of silver.

When the ratio then contracted to an opposite historical extreme of 50, for example, the trader would then sell his or her 100 ounces for two ounces of gold.

In this manner, the trader would continue to accumulate quantities of metal seeking extreme ratio numbers to trade and maximize holdings.

Note that no dollar value is considered when making the trade; the relative value of the metal is considered unimportant.

DYI’s averaging formula is best used when accumulating bullion.  Simply buy up to the stated allocation only selling/buying when necessary [lessen capital gains taxes].  For those in the distribution stage [retirees] of life sells off gold or silver to bring back in line with the current allocation.
DYI

%
Stock & Bonds
Allocation Formula
10-01-19
Updated Monthly

% Allocation = 100 – [100 x (Current PE10 – Avg. PE10 / 4)  /  (Avg.PE10 x 2 – Avg. PE10 / 2)]


% Stock Allocation    0% (rounded)
% Bond Allocation 100% (rounded) 

Logic behind this approach:
--As the stock market becomes more expensive, a conservative investor's stock allocation should go down. The rationale recognizes the reduced expected future returns for stocks, and the increasing risk. 
--The formula acknowledges the increased likelihood of the market falling from current levels based on historical valuation levels and regression to the mean, rather than from volatility. Many agree this is the key to value investing.  
Please note there is controversy regarding the divisor (Avg. PE10).  The average since 1881 as reported by Multpl.com is 16.70.  However, Larry Swedroe and others believe that using a revised Shiller P/E mean of 19.6 , the number since 1960 ( a 53-year period), reflects more modern accounting procedures.


DYI adheres to the long view where over time the legacy (prior 1959) values will be absorbed into the average.  Also it can be said with just as much vigor the last 25 years corporate America has been noted for accounting irregularities.  So....If you use the higher or lower number, or average them, you'll be within the guide posts of value.

Please note:  I changed the formula when the Shiller PE10 is trading at it's mean stocks and bonds will be at 50% - 50% representing Ben Graham's Defensive investor starting point; only deviating from that norm as valuations rise or fall.        
  
DYI


This blog site is not a registered financial advisor, broker or securities dealer and The Dividend Yield Investor is not responsible for what you do with your money.
This site strives for the highest standards of accuracy; however ERRORS AND OMISSIONS ARE ACCEPTED!
The Dividend Yield Investor is a blog site for entertainment and educational purposes ONLY.
The Dividend Yield Investor shall not be held liable for any loss and/or damages from the information herein.
Use this site at your own risk.

PAST PERFORMANCE IS NO GUARANTEE OF FUTURE RESULTS.

The Formula.
Margin of Safety!

Central Concept of Investment for the purchase of Common Stocks.
"The danger to investors lies in concentrating their purchases in the upper levels of the market..."

Stocks compared to bonds:
Earnings Yield Coverage Ratio - [EYC Ratio]

EYC Ratio = 1/PE10 x 100 x 1.1 / Bond Rate
1.75 plus: Safe for large lump sums & DCA
1.30 plus: Safe for DCA

1.29 or less: Mid-Point - Hold stocks and purchase bonds.

1.00 or less: Sell stocks - Purchase Bonds

Current EYC Ratio: 1.25(rounded)
As of  10-01-19
Updated Monthly

PE10 as report by Multpl.com
DCA is Dollar Cost Averaging.
Lump Sum any amount greater than yearly salary.

PE10  ..........29.59
Bond Rate....2.98%

Over a ten-year period the typical excess of stock earnings power over bond interest may aggregate 4/3 of the price paid. This figure is sufficient to provide a very real margin of safety--which, under favorable conditions, will prevent or minimize a loss......If the purchases are made at the average level of the market over a span of years, the prices paid should carry with them assurance of an adequate margin of safety.  The danger to investors lies in concentrating their purchases in the upper levels of the market.....

Common Sense Investing:
The Papers of Benjamin Graham
Benjamin Graham