The
Great Melt!
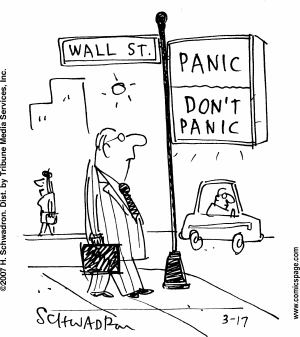
The Best Time to Panic?
Before Everyone Else!
Kenneth E. Royer
Dividend Yield Investor
David Stockman on the Coming Financial Panic and the 2020 Election
David Stockman: It’s very difficult to know. It is not inconceivable that the Fed and other central banks could pull a couple more rabbits out of their hats.
Also, Trump could take the trade war to the edge and then pull back like he constantly does. He flinches constantly. He could do so again if he sees the market moving lower too fast. But if you look at the charts, there are massive air pockets down below, let’s say, the 2700, 2800 level on the S&P 500.
If there’s an event—like some tankers blow up in the Persian Gulf or something really bad happens in the Taiwan Straits or the Chinese pull some real retaliatory stunt like dumping a couple billion bonds in one hour—it could tank the market.
And remember 80% of daily volume in the stock market is essentially either index-driven ETFs or various kinds of quantitative, machine-driven investment strategies. If that ever breaks loose, the market will go through an air pocket, and then it’s all over except for the shouting.
Because if the S&P 500 drops 400, 500, 600 points, you will trigger another go-round in the corporate C-suites. They’ll suddenly wake up like they did in October 2008 and say, “Oh my God, we’ve got too much inventory, we’ve horded too much labor, we’ve got a lot of assets that aren’t producing returns.” And then they go into these big restructuring programs where they lay off workers by the tens of thousands and take huge write-downs, close facilities, and so forth. The next thing you know, you have a C-suite–triggered recession. That’s how it happens these days.
Recessions don’t happen because the Fed is tightening credit costs for Main Street. That’s the old days. That’s your grandfather’s economy and your grandfather’s Fed.
But we’re now in the era of bubble finance.
The Fed basically inflates the financial system until it collapses, and then it spills over into the mainstream economy through corporate panics.
If the stock market cuts through these air pockets down below, the recession will happen instantly, and no one will see it coming—just like in 2008.
I remember in the spring of 2008 they were still talking about the Goldilocks economy. And in November 2008, they were talking about the end of the world.
This is exactly what I think will happen if the stock market breaks loose.
We don’t know when it will happen. It could happen before November 2020 or after it. No one can really predict.
I think the odds are that it will happen before then, and if it does, Trump is toast. Elizabeth Warren will be the next president of the United States, and as that prospect becomes even more probable, the panic in the stock market will be something to behold. It will be worse than anything we’ve seen since October 1987.
If you talk about volatility, you haven’t seen nothing yet. Wait until the election gets really in full heat next year.
I think Elizabeth Warren will come to the top. Joe Biden is quasi senile, and he’s going to fall by the wayside. Bernie just isn’t going to cut it with the mainstream Democrats. So, Warren is going to pull ahead.
And if the stock market is faltering or it has crashed and the economy’s in trouble, you’ll have a populist, redistributionist, big government statist president and Congress.
That’s a totally different world from this dance fantasy that we’ve been living for the last 10 or 15 years.
Stockman Continues....
So, at the very worst time in the business cycle, Trump is massively increasing the structural deficit.
When I say the very worst time, it is both in calendar time and in cycle time. Because in calendar time, we’re entering the 2020s when all 80 million baby boomers are going to retire.
We’re going to be having 10–11,000 retirements a day for most of the decade. And by the end of the decade, there will be 80 million more people on Social Security, Medicare, and Medicaid.
The cost of the welfare state is going to soar even as the political environment will become totally nonfunctional, because no one wants to pay more taxes.
The military-industrial complex is running with a trillion-dollar budget. There’s just no give anywhere, not on taxes, not on defense spending, not on entitlements, not on the entire welfare state.
So, the fiscal situation is going to completely unravel in the decade ahead.The real debt of the country today is not the $22 trillion that’s on the books. That’s backward looking. It’s really $42 trillion. That’s because we have $20 trillion more baked into the cake under almost any scenario you can look at over the next decade, based on these factors I’ve just enumerated.
Now, $42 trillion of debt on a GDP that might get to be, in nominal terms, $27, $28 trillion by then (but probably less), that’s a 150% debt-to-GDP ratio. I just don’t see how you get out of that box.
We’re in a demographic and fiscal dead end. It’s a very dangerous prospect and one with no obvious answer on how to escape.

Points of ‘secular’ undervaluation such as 1922, 1932, 1949, 1974 and 1982 typically occurred about 50% below historical mean valuations, and were associated with subsequent 10-year nominal total returns approaching 20% annually. By contrast, valuations similar to 1929, 1965 and 2000 were followed by weak or negative total returns over the following decade. That’s the range where we find ourselves today. Of course, we also won’t be surprised if the S&P 500 ends up posting weak or negative total returns in the 2007-2017 decade, which would require nothing but a run-of-the-mill bear market over the next couple of years. - John Hussman


The
Dow/Gold Ratio chart shows the ratio of the price of the Dow to the price of
gold. Another way to look at it is the number of ounces of gold it takes to buy
one share of the Dow. For example, with the Dow at 10,000 and gold at 500, it
requires 20 ounces of gold to buy one share of the Dow, so the ratio is 20. The
reason for using gold is that gold is the most unbiased form of money in
existence. Fake government paper money comes and goes, but gold has been money
for thousands of years. It is the ultimate store of wealth.
The
chart shows the cyclical nature of the battle between paper assets and hard
assets. Paper assets excel when everyone is fixated on growth. When the growth
phase ends, and preservation of wealth becomes the paramount concern, gold
tends to excel. When paper burns, gold shines.
The
long term trend of the ratio is up at a rate of 1.25% per year. This should be
expected as the process of mining gold becomes more efficient and cheaper due
to advances in machinery, energy, exploration technology, chemicals, etc. In
fact, the advances in mining probably match the efficiency gains seen in the
economy in general.
The
ratio has stayed within a defined channel except for an over shoot around 1980.
An explanation for the over shoot could be that gold was pricing in the
possibility of continued high inflation.
The
Dow/Gold Ratio chart shows that we witnessed the end of an era for equities.
Stocks had an 18 year bull market where buy and hold was the guaranteed way to
make money. Unfortunately for the stock market bulls, asset classes go in and
out of favor, and gold proved to be the next great asset class. The chart shows
that, as predicted, the ratio reached the bottom of a potential channel. Where
the ratio goes next is dependent on government policy. Zero interest rates
coupled with huge government deficits could send the Dow/Gold ratio far below
5.

DYI:
Over
the next 20 years plus – stocks, residential real estate, long term corporate
and to a lessor degree long term government bonds will experience the great
melt down for prices. Boomer’s are now
about half way through – [as of 4 days ago including this blogger] – to retirement. As a group they are desperate for cash and
they have been systematically selling since 2008. The only reason prices are back to the
heavens is severe Federal involvement especially the Federal Reserve with their
sub atomic low interest rate policy.
When the next recession hits whether caused by standard economic forces
or simply asset prices dropping the Feds will pull down rates to the negative
level with 3 to 5 year T-notes!
Mr.
Market
In
the end Mr. Market will have his way as he is far more powerful than any
government or Fed chairman. With 80
million Boomer’s selling off real estate, stocks and bonds, AND with Generation
X’er’s and Millennial’s so deeply in debt the only way Boomer’s will find a
buyer is with lower and lower prices.
That’s right the best time to panic is before everyone else!
Updated Monthly
No comments:
Post a Comment