Margin of Safety!
Central Concept of Investment for the purchase of Common Stocks.
"The danger to investors lies in concentrating their purchases in the upper levels of the market..."
Stocks compared to bonds:
Earnings Yield Coverage Ratio - [EYC Ratio]
Lump Sum any amount greater than yearly salary.
PE10 ..........39.22
Bond Rate...2.40%
EYC Ratio = 1/PE10 x 100 x 1.1 / Bond Rate
1.75 plus: Safe for large lump sums & DCA
1.29 or less: Mid-Point - Hold stocks and purchase bonds.
1.00 or less: Sell stocks - Purchase Bonds
Current EYC Ratio: 1.17(rounded)
As of 9-1-21
Updated Monthly
Bond Rate is the rate as reported by
DCA is Dollar Cost Averaging.
Lump Sum is any dollar amount greater than one year salary.
Over a ten-year period the typical excess of stock earnings power over bond interest may aggregate 4/3 of the price paid. This figure is sufficient to provide a very real margin of safety--which, under favorable conditions, will prevent or minimize a loss......If the purchases are made at the average level of the market over a span of years, the prices paid should carry with them assurance of an adequate margin of safety. The danger to investors lies in concentrating their purchases in the upper levels of the market.....
Common Sense Investing:
The Papers of Benjamin Graham
Benjamin Graham
%
Gold/Silver
Allocation
9-1-21
Updated Monthly
100 x (Current GS – Avg. GS / 4)
_______________________________________
(Avg.GS x 2 – Avg. GS / 2)
[The formula's answer allocates silver percentage]
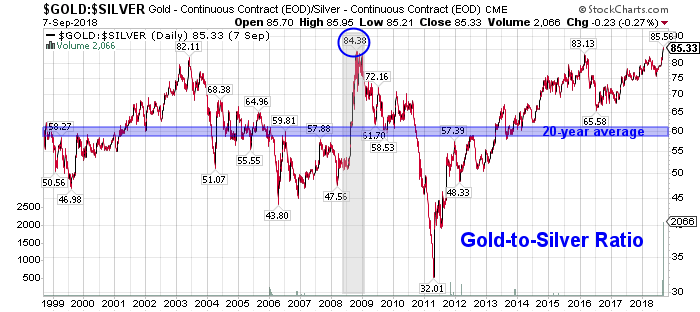
Current Gold/Silver Ratio 76 (rounded)
Average Gold/silver Ratio 50 [Since the year 1900]
Allocation:
Gold 15%
Silver 85%
Average Gold/Silver Ratio since 1900
50 to 1
Gold and silver bullion buyers and traders use the fluctuating Gold Silver Ratio to better determine which precious metal may be poised to outperform the other.
The essence of trading the gold-silver ratio is to switch holdings when the ratio swings to historically determined extremes.
So...
When a trader possesses one ounce of gold and the ratio rises to an unprecedented 100, the trader would sell their single gold ounce for 100 ounces of silver.
When the ratio then contracted to an opposite historical extreme of 50, for example, the trader would then sell his or her 100 ounces for two ounces of gold.
In this manner, the trader would continue to accumulate quantities of metal seeking extreme ratio numbers to trade and maximize holdings.
Note that no dollar value is considered when making the trade; the relative value of the metal is considered unimportant.
DYI’s averaging formula is best used when accumulating bullion. Simply buy up to the stated allocation only selling/buying when necessary [lessen capital gains taxes]. For those in the distribution stage [retirees] of life sell off gold or silver to bring back in line with the current allocation.
DYI
***********************************
***********************************
Updated Monthly
AGGRESSIVE PORTFOLIO - ACTIVE ALLOCATION - 9/1/21
Active Allocation Bands (excluding cash) 0% to 50%
50% - Cash -Short Term Bond Index - VBIRX
50% -Gold- Global Capital Cycles Fund - VGPMX **
0% -Lt. Bonds- Long Term Bond Index - VBLTX
0% -Stocks- Total Stock Market Index - VTSAX
[See Disclaimer]** Vanguard's Global Capital Cycles Fund maintains 25%+ in precious metal equities the remainder are domestic or international companies they believe will perform well during times of world wide stress or economic declines.
This blog site is not a registered financial advisor, broker or securities dealer and The Dividend Yield Investor is not responsible for what you do with your money.
This site strives for the highest standards of accuracy; however ERRORS AND OMISSIONS ARE ACCEPTED!
The Dividend Yield Investor is a blog site for entertainment and educational purposes ONLY.
The Dividend Yield Investor shall not be held liable for any loss and/or damages from the information herein.
Use this site at your own risk.
PAST PERFORMANCE IS NO GUARANTEE OF FUTURE RESULTS.
%
Stocks & Bonds
Allocation Formula
9-1-21
Updated Monthly
% Allocation = 100 – [100 x (Current PE10 – Avg. PE10 / 4) / (Avg.PE10 x 2 – Avg. PE10 / 2)]
% Stock Allocation 0% (rounded)
% Bond Allocation 100% (rounded)
Logic behind this approach:--As the stock market becomes more expensive, a conservative investor's stock allocation should go down. The rationale recognizes the reduced expected future returns for stocks, and the increasing risk.
--The formula acknowledges the increased likelihood of the market falling from current levels based on historical valuation levels and regression to the mean, rather than from volatility. Many agree this is the key to value investing.
Please note there is controversy regarding the divisor (Avg. PE10). The average since 1881 as reported by Multpl.com is 16.70. However, Larry Swedroe and others believe that using a revised Shiller P/E mean of 19.6 , the number since 1960 ( a 53-year period), reflects more modern accounting procedures.
DYI adheres to the long view where over time the legacy (prior 1959) values will be absorbed into the average. Also it can be said with just as much vigor the last 25 years corporate America has been noted for accounting irregularities. So....If you use the higher or lower number, or average them, you'll be within the guide posts of value.
Please note: I changed the formula when the Shiller PE10 is trading at it's mean - stocks and bonds will be at 50% - 50% representing Ben Graham's Defensive investor starting point; only deviating from that norm as valuations rise or fall.
DYI
This blog site is not a registered financial advisor, broker or securities dealer and The Dividend Yield Investor is not responsible for what you do with your money.
This site strives for the highest standards of accuracy; however ERRORS AND OMISSIONS ARE ACCEPTED!
The Dividend Yield Investor is a blog site for entertainment and educational purposes ONLY.
The Dividend Yield Investor shall not be held liable for any loss and/or damages from the information herein.
Use this site at your own risk.
PAST PERFORMANCE IS NO GUARANTEE OF FUTURE RESULTS.
The Formula. 9-1-21
Updated Monthly
Secular Market Top - Since January 2000
+208.4% Dow
+400.6% Transports
+229.0% Utilities
+206.9% S&P 500
+271.8% Nasdaq
+ 70.5% 30yr Treasury Bond
+528.3% Gold
+168.5% Oil
+72.9% Swiss Franc's
From High to Low - Since Year 2000
+ 528.3% Gold
+ 400.6% Transports
+ 271.8% Nasdaq
+ 229.0% Utilities
+ 208.4% Dow
+ 206.9% S&P 500
+ 168.5% Oil
+ 72.9% Swiss Franc's
+ 70.5% 30yr Treasury Bonds
December 1999 Shiller PE10 was 44.19
August 2000 S&P 500 dividend yield was 1.11%
Shiller PE10 9-1-21 is 39.22
S&P 500 dividend yield 9-1-21 is 1.27%
[Shiller PE10 & dividend yield is reported using data from the beginning of the month when I update. It may or may not exactly be the first trading day of the month.]
Stock-earnings yield 2.55%
Stock-earnings yield/bond yield = 1.06
Dividend yield/bond yield = .53
***************************
It is easily seen in the year 2000 the Nasdaq was
horribly overvalued and gold was on the give
away table, such lopsided returns 20 years later!
No comments:
Post a Comment