Watch the Treasury Yield Spread
Spread as of 6/15/18 is 0.35
DYI:
This article was written November 29, 2017 though dated the explanation
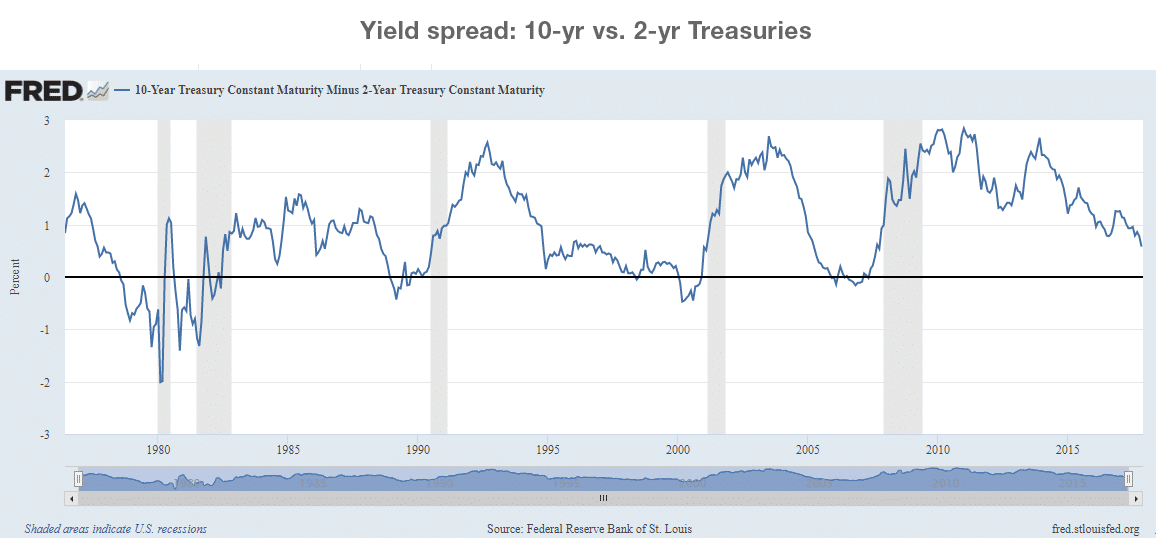
of the recessions and inverted yield curve is excellent.With the Federal Reserve on course to raise its target interest rate again in December, there’s concern that overly aggressive monetary policy could endanger the current US economic expansion, one of the longest in history, albeit not the most robust one so far. One of the leading indicators we look at to gauge the potential for recession is the US Treasury 10-2 year yield spread, pictured above. It shows the difference between the yield on 10-year Treasuries vs. 2-year Treasuries, and measures the additional compensation an investor would earn for holding longer maturity bonds. Now take a look at the gray vertical bars, which indicate US recessions.
Notice that prior to the start of recessions, the blue line dipped below zero. That is when the yield on 2-year Treasury bonds was actually higher than the yield on 10-year Treasury bonds.
Below zero is an unusual situation because it suggests investors have a weak economic outlook and believe long-term yields are likely to fall.
Also, note that historically, even after the spread turns negative, roughly a year or more passes before the recession occurs. So as with all market indicators, this measure isn’t a precision instrument.
DYI:
Using this indicator alone will only give you a “heads up” that a
recession will be arriving in the relative near future. However its lag time is too long for any
aggressive moves such as put options or short positions.
- DYI’s Recession warning checklist:
- Two year Treasury notes invert 10 year Treasury bonds.
- Widening credit spread…Comparing yields between the 5 year Treasury note and Vanguard’s High-Yield Corporate Bond Fund.
- Falling stock prices…S&P 500 fifty day moving average below the two hundred day moving average.
- Falling Home Builders Index…The indexes fifty day average below its respective two hundred day average.
- Purchases Managers Index: PMI below 50
DYI: So
far the only indicator that is negative is widening credit spread between 5
year Treasury notes and Vanguard’s High Yield Corporate Bond Fund [junk
bonds] everything else remains on solid
ground for continued economic expansion.
For right now all that can be said things are moving in the direction of
recession but we are not even close to being imminent.
DYI
No comments:
Post a Comment