Friday, November 29, 2019

Hard Money Advocates
Win in Texas

Texas Gold Bullion Depository Getting Closer to Reality; Will Allow Texans to Do Business in Gold

Last week, the Texas House unanimously passed a bill that would facilitate the establishment and operation of the Texas Bullion Depository; helping to undermine the Federal Reserve’s monopoly on money. 
The creation of a state gold depository in Texas represents a power shift away from the federal government to the state, and it provides a blueprint that could ultimately end the Fed. The facility will not only provide a secure place for individuals, business, cities, counties, government agencies, and even other countries to to store gold and other precious metals, the law also creates a mechanism to facilitate the everyday use of gold and silver in business transactions. In short, a person will be able to deposit gold or silver – and pay other people through electronic means or checks – in sound money. 
As part of the process, Rep. Giovanni Capriglione (R-Keller) introduced House Bill 3169 (HB3169) in March. The legislation includes various provisions for the operation and administration of the Texas Bullion Depository, to define the roles of depository agents, to direct the appropriation of money from depository fees, charges, penalties, and other amounts related to the depository. The bill also  includes provisions to exempt precious metals in the depository from property taxes. 
On April 20, the Investment and Financial Services Committee passed HB3169 by a 5-0 vote. It was fast-tracked to from there, and the full House passed it by a 143-0 vote on May 5. 
Once operational, private individuals and entities will be able to purchase goods and services, using assets in the vault the same way they use cash today. Exemption from taxation of precious metals stored in the vault will further facilitate the use of stored bullion as money. 
This would incentivize the use the Texas Bullion Depository. If they then start allowing checks and debit cards to be used in conjunction with the bullion accounts – likely the next step  – it would essentially create a specie- and bullion-based bank introducing currency competition with Federal Reserve notes.
DYI: 
All that is needed is for the top 5 states by population [California, Texas, Florida, New York, and Illinois] to create their bullion banks.  The smallest states by population would immediately follow suit as they would be forced to compete in the precious metals banking business.  The remaining middle sized states would fall into line not wanting to be left out.  I don’t see this ending the Fed but no doubt would put a serious dent into their monopoly.  If this becomes popular with Texans I see Florida falling in line as the remaining three states saddled with leftist Federal policies.
DYI
Thursday, November 28, 2019

%
Stock & Bonds
Allocation Formula
12-01-19
Updated Monthly

% Allocation = 100 – [100 x (Current PE10 – Avg. PE10 / 4)  /  (Avg.PE10 x 2 – Avg. PE10 / 2)]


% Stock Allocation    0% (rounded)
% Bond Allocation 100% (rounded) 

Logic behind this approach:
--As the stock market becomes more expensive, a conservative investor's stock allocation should go down. The rationale recognizes the reduced expected future returns for stocks, and the increasing risk. 
--The formula acknowledges the increased likelihood of the market falling from current levels based on historical valuation levels and regression to the mean, rather than from volatility. Many agree this is the key to value investing.  
Please note there is controversy regarding the divisor (Avg. PE10).  The average since 1881 as reported by Multpl.com is 16.70.  However, Larry Swedroe and others believe that using a revised Shiller P/E mean of 19.6 , the number since 1960 ( a 53-year period), reflects more modern accounting procedures.


DYI adheres to the long view where over time the legacy (prior 1959) values will be absorbed into the average.  Also it can be said with just as much vigor the last 25 years corporate America has been noted for accounting irregularities.  So....If you use the higher or lower number, or average them, you'll be within the guide posts of value.

Please note:  I changed the formula when the Shiller PE10 is trading at it's mean stocks and bonds will be at 50% - 50% representing Ben Graham's Defensive investor starting point; only deviating from that norm as valuations rise or fall.        
  
DYI


This blog site is not a registered financial advisor, broker or securities dealer and The Dividend Yield Investor is not responsible for what you do with your money.
This site strives for the highest standards of accuracy; however ERRORS AND OMISSIONS ARE ACCEPTED!
The Dividend Yield Investor is a blog site for entertainment and educational purposes ONLY.
The Dividend Yield Investor shall not be held liable for any loss and/or damages from the information herein.
Use this site at your own risk.

PAST PERFORMANCE IS NO GUARANTEE OF FUTURE RESULTS.

The Formula.
Margin of Safety!

Central Concept of Investment for the purchase of Common Stocks.
"The danger to investors lies in concentrating their purchases in the upper levels of the market..."

Stocks compared to bonds:
Earnings Yield Coverage Ratio - [EYC Ratio]

EYC Ratio = 1/PE10 x 100 x 1.1 / Bond Rate
1.75 plus: Safe for large lump sums & DCA
1.30 plus: Safe for DCA

1.29 or less: Mid-Point - Hold stocks and purchase bonds.

1.00 or less: Sell stocks - Purchase Bonds

Current EYC Ratio: 1.20(rounded)
As of  12-01-19
Updated Monthly

PE10 as report by Multpl.com
DCA is Dollar Cost Averaging.
Lump Sum any amount greater than yearly salary.

PE10  ..........30.67
Bond Rate...2.98%

Over a ten-year period the typical excess of stock earnings power over bond interest may aggregate 4/3 of the price paid. This figure is sufficient to provide a very real margin of safety--which, under favorable conditions, will prevent or minimize a loss......If the purchases are made at the average level of the market over a span of years, the prices paid should carry with them assurance of an adequate margin of safety.  The danger to investors lies in concentrating their purchases in the upper levels of the market.....

Common Sense Investing:
The Papers of Benjamin Graham
Benjamin Graham

Monday, November 25, 2019

Dollar
Woes 
Historic changes in the world economic system don’t happen overnight. In fact, they can take decades.
DYI:  Decades is exactly correct!  Think of England with the timing being our American Civil War [War of Northern Aggression].  If the union stayed intact any reasonable critical thinking citizen would know that Pound Sterling days would end as the world’s reserve currency.  This transfer of power wasn’t accomplished until the 1930’s.  After World War II America’s military and economic power was in full bloom.  Decades it will be before economic currency power is shared among multiple nations.  The demise of the almighty buck will be a slow grinding affair decade after decade until the ultimate collapse arrives. 

One of those changes has been taking place since May 2014 – namely, the weakening of the U.S. dollar’s hegemony as the global reserve currency.
Agora Financial put it plainly in a recent issue of their 5-Minute Forecast, stating, “You don’t have to buy into imminent ‘collapse’ to know the rest of the world wants to get out from under the dollar’s thumb.”
So the world is slowly turning away from the dollar, a sluggish process Agora calls “de-dollarization.” They claim this process has its origins in May 2014, “when Russian media described a ‘de-dollarization meeting’ among Russian and Chinese leaders.”
Since then, more countries have started taking part in the “de-dollarization” process, which has escalated thanks to economic sanctions the U.S. imposed in May 2018 to make sure the dollar “stays in power.”
The list of countries that want to dethrone the dollar includes, but isn’t limited to: “Russia, Iran, Venezuela, Cuba, Sudan, Zimbabwe, Myanmar, the Democratic Republic of the Congo, North Korea and […] also countries like China, Pakistan and Turkey, which are not under full sanctions but rather targets of other punitive economic measures.”
Individually, these countries wouldn’t stand a chance against the still-established dollar hegemony, 
but together they “equal America’s economic output,” according to Agora.
The European workaround being developed for these countries to bypass using the U.S. dollar in business transactions, while avoiding sanctions, is called INSTEX:
DYI

Saturday, November 23, 2019

Coming to
America Soon??
Selling such bonds – a hot topic after Bank of Japan Governor Haruhiko Kuroda commented on the idea this month – would allow the government to lock in cheap long-term funding and give yield-starved investors higher returns. 
It could also offer the BOJ a new tool for its “yield-curve control” (YCC) policy by helping prevent excessive declines in super-long bond yields, which hurt returns of pension funds. 
Adding 50-year bonds could drain liquidity from markets of other super-long bonds, making yields vulnerable to wild swings, MOF officials say. It is also unclear whether 50-year bonds would be traded much, as investors could suffer huge losses if yields spike. 
Long bonds have drawn global attention as countries try to use super-low rates to lock in debt. Some European countries have sold 100-year bonds, a move Treasury Secretary Steven Mnuchin said the United States could also consider.
DYI: 

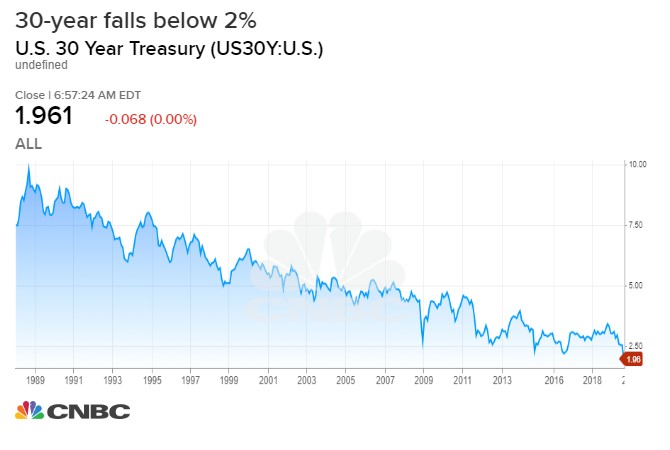
Sub atomic low interest rates with massive budget deficits as far as one can see it is highly likely the Federal government will follow Europe using ultra long term financing locking in these low rates.  Of course there will come a time [if these bonds come to fruition] they will be the flip side of the past 40 years and become the short of a lifetime as interest rates begin their northern journey.  For investors as oppose to speculators long term bonds [10 years or longer] have played out the huge bulk of their bull market that began in 1981.

Image result for 10 year treasury yield history chart pictures
Yield as of 11/22/19
2.22%
DYI’s model portfolio remains heavily in precious metals and short term bills/notes.  
Updated Monthly

AGGRESSIVE PORTFOLIO - ACTIVE ALLOCATION - 11/1/19

Active Allocation Bands (excluding cash) 0% to 50%
51% - Cash -Short Term Bond Index - VBIRX
49% -Gold- Global Capital Cycles Fund - VGPMX **
 0% -Lt. Bonds- Long Term Bond Index - VBLTX
 0% -Stocks- Total Stock Market Index - VTSAX
[See Disclaimer]
My market sentiment scale has not changed since March 28, 2017 when I changed Lt. Bonds from Max-Optimism to Denial of Problem and Gold from Relief to Hope.    


Market Sentiment

Smart Money buys aggressively!
Capitulation
Despondency
Max-Pessimism *Market Bottoms* Short Term Bonds
Depression MMF

Hope Gold
Relief *Market returns to Mean*

Smart Money buys the Dips!
Optimism
Media Attention
Enthusiasm

Smart Money - Sells the Rallies!
Thrill
Greed
Delusional
Max-Optimism *Market Tops* U.S. Stocks
Denial of Problem Long Term Bonds
Anxiety
Fear
Desperation

Smart Money Buys Aggressively!
Capitulation
Amazing how in my lifetime interest rates have now [or at least very close] gone full circle.  I’m 65 years old and easily remembering when rates were low and then raised all through the late 60’s, 70’s, and then peaked in 1981. Rates began their southern journey to where we are now [full circle].
DYI

Tuesday, November 12, 2019

Bubble
News
Image result for s&p 500 vs corporate profits after taxes chart pictures
It isn’t just the deviation of asset prices from corporate profitability which is skewed, but also reported earnings per share. As I have discussed previously, the operating and reported earnings per share are heavily manipulated by accounting gimmicks, share buybacks, and cost suppression. To wit: 
“It should come as no surprise that companies manipulate bottom line earnings to win the quarterly ‘beat the estimate’ game. By utilizing ‘cookie-jar’ reserves, heavy use of accruals, and other accounting instruments they can mold earnings to expectations. 
‘The tricks are well-known: A difficult quarter can be made easier by releasing reserves set aside for a rainy day or recognizing revenues before sales are made, while a good quarter is often the time to hide a big ‘restructuring charge’ that would otherwise stand out like a sore thumb. 
What is more surprising though is CFOs’ belief that these practices leave a significant mark on companies’ reported profits and losses. When asked about the magnitude of the earnings misrepresentation, the study’s respondents said it was around 10% of earnings per share.’
DYI: 
Stocks remain with sky high valuations.  A mild recession will bring down valuations by 50% along with their prices.  At these levels it is a horrible time to purchase common stocks as returns over the next 10 to 12 years will be sub atomically low and after all expenses will be negative.  So hold onto your cash and precious metals until valuations improve for stocks and bonds.  The Great Wait Continues…
 DYI
Silver versus gold remains the big trade for bullion accumulators or for those buying physical metals based upon DYI’s model portfolio.
%
Gold/Silver
Allocation
11-12-19

Updated Monthly

100 – [100 x (Current GS – Avg. GS / 4)
_______________________________________

(Avg.GS x 2 – Avg. GS / 2)
[The formula's answer allocates gold percentage]

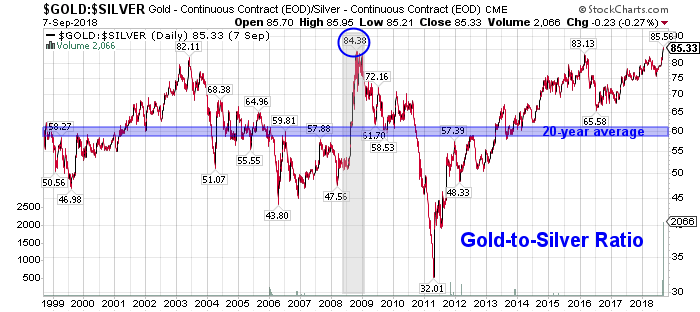
Current Gold/Silver Ratio 87

Average Gold/silver Ratio 50

Allocation:    
Gold       1%
Silver   99%
Image result for gold to silver ratio chart pictures
Average Gold/Silver Ratio since 1900
50 to 1
Gold and silver bullion buyers and traders use the fluctuating Gold Silver Ratio to better determine which precious metal may be poised to outperform the other.

The essence of trading the gold-silver ratio is to switch holdings when the ratio swings to historically determined extremes. So:

When a trader possesses one ounce of gold and the ratio rises to an unprecedented 100, the trader would sell their single gold ounce for 100 ounces of silver.

When the ratio then contracted to an opposite historical extreme of 50, for example, the trader would then sell his or her 100 ounces for two ounces of gold.

In this manner, the trader would continue to accumulate quantities of metal seeking extreme ratio numbers to trade and maximize holdings.

Note that no dollar value is considered when making the trade; the relative value of the metal is considered unimportant.

DYI’s averaging formula is best used when accumulating bullion.  Simply buy up to the stated allocation only selling/buying when necessary [lessen capital gains taxes].  For those in the distribution stage [retirees] of life sells off gold or silver to bring back in line with the current allocation.
DYI

Friday, November 8, 2019

Bubble
News

Our Currency, Your Problem

We’ve been witnessing widespread protest and unrest across countries with distinct political and economic systems, such as Hong Kong, France, Chile, Spain, Ecuador, Lebanon and Venezuela just to name a few. Those with vested interests and an ideological solution to sell insist it’s all because of socialism, capitalism or some other ism, but the truth is this goes far deeper than that. 
What’s actually happening is the geopolitical and economic paradigm that’s dominated the planet for decades is failing, and rather than address the failure in any real sense. 
Elites globally have decided to loot everything they possibly can until the house of cards comes crashing down.
Geometric Standard Deviation Average
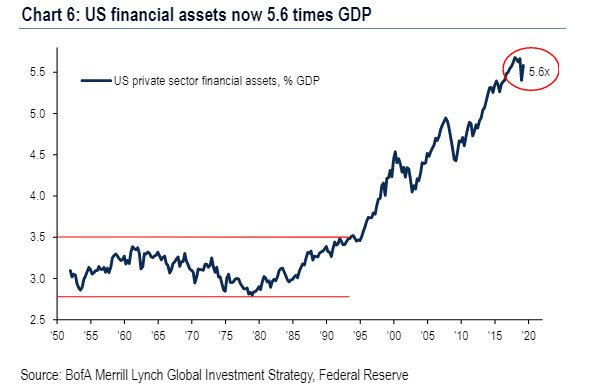
Here's why the stock market can never crash or the US will slide into a historic depression: financial assets are now 5.6x GDP


10-year Yield (Log Scale)
Which gets us to the key point surrounding the unsustainable nature of the world’s monetary and financial system. Specifically, we already live in a world where several powers (namely China and Russia) have very publicly and clearly elucidated they will not function as U.S. client states going forward. They appear to be on the winning side of history because it’s much harder to maintain global empire than to frustrate it at this point, but the U.S. maintains an enormous advantage when making moves on the geopolitical chessboard. It’s not the ubiquitous military bases or advanced technology, but a more esoteric and stealth weapon — the U.S. dollar.
Whenever I say stuff like this people insist there’s nothing ready to replace the USD as a global reserve currency. On this front I agree, but my argument isn’t that another nation-state fiat is going to totally usurp the USD on the world stage in the years ahead (nor should anyone want that). 
Rather, my view is competing powers will figure out a way to avoid the dollar in an increasing percentage of global transactions simply because they have no other option in a world where the dollar’s been fully weaponized to achieve U.S. geopolitical goals.

Related image
Image result for dow/gold ratio chart pictures
Ultimately, I hope humanity learns from the experience of recent decades and never again permits one country to control monetary policy for the entire planet. A reserve currency controlled by a single nation is effectively the most potent geopolitical weapon ever invented. No country or institution should ever have such power, now or in the future.
 DYI: 
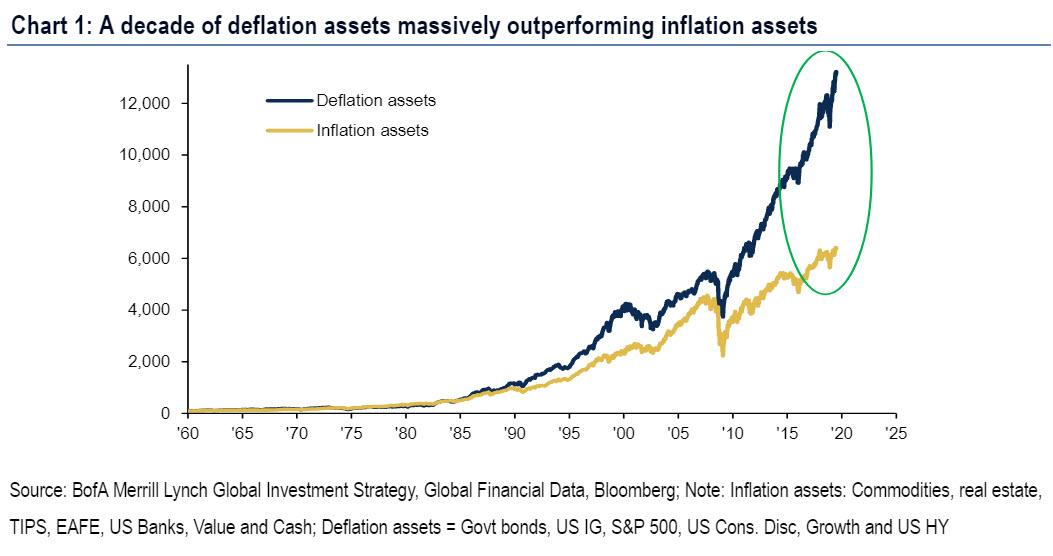
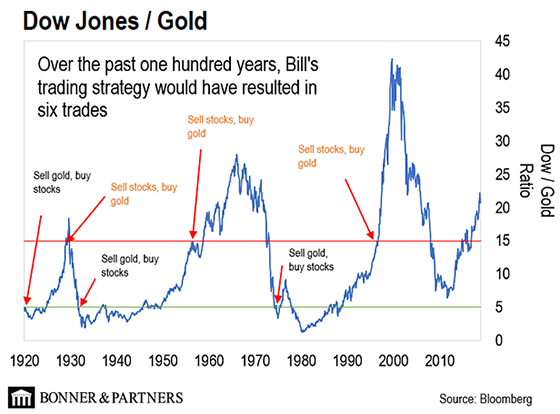
Traditional stocks and bonds due to massive overvaluation are set to deliver sub par returns for the next 20 years.  This is for monies held or purchased today for stocks and bonds go to sleep like Rip Van Winkle waking 20 years from now.  Expect an average annual return of around 3% for a standard 60% stocks, 30% bonds, and 10% cash (T-bills) retirement portfolio.  This return is before all expenses such as management fees [1%], commission [0.20%], trading impact costs [0.50%] and the Granddaddy inflation [4% est.]  All told you are looking at a 2.7% negative return!

Eventually Mr. Market will have his way with stocks and bonds dropping from their lofty perch!  Whether or not this causes an economic depression is to be seen however it will bring a deflationary smash.  Stopping after 5 or more years when the money printing overwhelms deflation.  For now the place to be is with precious metals whether physical bars/coins or shares of the mining companies with a heavy dose of cash.  The Great Wait continues with better values ahead for the patience investor.
Updated Monthly

AGGRESSIVE PORTFOLIO - ACTIVE ALLOCATION - 11/1/19

Active Allocation Bands (excluding cash) 0% to 50%
71% - Cash -Short Term Bond Index - VBIRX
29% -Gold- Global Capital Cycles Fund - VGPMX **
 0% -Lt. Bonds- Long Term Bond Index - VBLTX
 0% -Stocks- Total Stock Market Index - VTSAX
[See Disclaimer]
**Tocqueville Gold Fund TGLDX is a pure play 100% junior gold mining gold fund.  Vanguard's Global Capital Cycles Fund maintains 25% in precious metal equities the remainder are companies they believe will perform well during times of world wide stress or economic declines.  

 This blog site is not a registered financial advisor, broker or securities dealer and The Dividend Yield Investor is not responsible for what you do with your money.
This site strives for the highest standards of accuracy; however ERRORS AND OMISSIONS ARE ACCEPTED!
The Dividend Yield Investor is a blog site for entertainment and educational purposes ONLY.
The Dividend Yield Investor shall not be held liable for any loss and/or damages from the information herein.
Use this site at your own risk.

PAST PERFORMANCE IS NO GUARANTEE OF FUTURE RESULTS.
DYI

Tuesday, November 5, 2019

11/01/19
Updated Monthly
Oil Prices: 
11/03/14....  $80.44
11/01/19......$64.97   

Down 19%(rounded)
(oil prices approximately five years earlier due to weekends & holidays)
ANS West Coast prices   
 OIL INDICATOR:  Positive  Oil indicator will remain positive until it's rise is greater than 75% from five years earlier.

Oil prices are well known for their volatility in the short term, longer term due to dwindling reserves energy prices are in a secular bull market.  Technologies such as fracking will extend the life of oil fields but major new discoveries arrive at a snails pace far slower than the world's growth.  

As long as prices rise in a slow and orderly pace our economy can adjust to those changes, however if prices spike (international tensions, war etc.) high energy costs behave as a massive deflationary tax. This will send our economy tumbling down and very possibly the U.S. stock market.

If oil prices rise greater than 75% from five years earlier, investors at that time should shift their portfolio geared towards deflationary times.  This would be an oil indicator as negative.

If oil prices rise from five years earlier less than 10% or drop then the inflationary play is in effect; a positive for economic growth along with possible higher stock prices.

Where to find five year earlier oil prices?  Alaska Department of Revenue    

Oil indicator positive              
  5%  High-Yield Corporate Bonds
10%  REIT's
10%  Energy
10%  P.M.'s
65%  Small Caps
  0%  Lt. Gov't Bonds

Oil indicator negative
  5%  REIT's
10%  Energy
10%  P.M's
10%  Small Caps
65%  Lt. Gov't Bonds

Vanguard Funds

REIT's
REIT Index Admiral  VGSLX

Energy
Energy Fund  VGENX

Precious Metals (P.M.'s)
Global Capital Cycles Fund VGPMX

Small Caps
Small Cap Value Index Admiral  VSIAX

High-Yield Corporate Bonds
High-Yield Corporate Bond Fund VWEHX

Long Term Government Bonds
Long-Term Government Bond Index Admiral  VLGSX

Disclaimer

This blog site is not a registered financial advisor, broker or securities dealer and The Dividend Yield Investor is not responsible for what you do with your money.
This site strives for the highest standards of accuracy; however ERRORS AND OMISSIONS ARE ACCEPTED!
The Dividend Yield Investor is a blog site for entertainment and educational purposes ONLY.
The Dividend Yield Investor shall not be held liable for any loss and/or damages from the information herein.

Use this site at your own risk.

PAST PERFORMANCE IS NO GUARANTEE OF FUTURE RESULTS.
11-1-19
Updated Monthly

Secular Market Top - Since January 2000

+137.9% Dow       
+260.7% Transports 
+206.3% Utilities

+108.7%  S&P 500
+106.1%  Nasdaq

+65.9%  30yr Treasury Bond

+421.9% Gold
+119.5% Oil
  +60.3% Swiss Franc's
    
From High to Low - Since Year 2000

+421.9% Gold
+260.7% Transports
+206.3% Utilities
+137.9% Dow
+119.5% Oil 
+108.7% S&P 500 
+106.1% Nasdaq  
+  65.9% 30yr Treasury Bonds
+  60.3% Swiss Franc's

December 1999 Shiller PE10 was 44.19               
August 2000 S&P 500 dividend yield was 1.11%  

Shiller PE10 11-1-19 is 30.40
S&P 500 dividend yield 11-1-19 is 1.86%
[Shiller PE10 & dividend yield is reported using data from the beginning of the month when I update.  It may or may not exactly be the first day.]

It is easily seen in the year 2000 the Nasdaq was horribly overvalued and gold was on the give away table, such lopsided returns 19 years later!

Also of interest the stodgy 30 year Treasury bond since the year 2000 outperformed the Dow, S&P 500 and Nasdaq until the Trump rally.  With valuations stretched to these lofty levels a value player such as DYI will once again place his monies in 30 year T-bonds or long term high quality corporate bonds out performing stocks over the next 10 to 15 years.  Please note due to the Fed's sub atomic low interest rates 30 year T-bonds or high quality long term corporate bonds will highly likely out perform stocks over the next 10 to 15 years with one big caveat; out performance will be losing far less money than stocks! Ouch!          
Bubble
News
The embattled German lender has struggled since the global financial crisis of 2008 and the subsequent debt crisis in the euro area. The bank has faced billion-dollar fines, increased market competition, a lower market share in both commercial and investment banking, as well as a series of management changes.

Chinese Investors Pile Into Gold As Economic Worries Surge

Holdings of the metal at the communist state’s four bullion-backed exchange-traded funds reached a record-breaking 50 metric tons at the end of September, according to a new report from industry group World Gold Council. That’s metal is worth around $2.4 billion. 
Chinese investors have plenty to worry about, says Gordon G. Chang, author of The Coming Collapse of China. 
In simple terms, the Chinese economy is on the rocks, and there is little that can be done to fix the problem. Or at least, what can be done – such as reducing state control – won’t be considered by the communist party leaders. 
As a result of the malaise, investors are seeking sanctuary in gold bullion.
 DYI

Saturday, November 2, 2019

Margin of Safety!

Central Concept of Investment for the purchase of Common Stocks.
"The danger to investors lies in concentrating their purchases in the upper levels of the market..."

Stocks compared to bonds:
Earnings Yield Coverage Ratio - [EYC Ratio]

EYC Ratio = 1/PE10 x 100 x 1.1 / Bond Rate
1.75 plus: Safe for large lump sums & DCA
1.30 plus: Safe for DCA

1.29 or less: Mid-Point - Hold stocks and purchase bonds.

1.00 or less: Sell stocks - Purchase Bonds

Current EYC Ratio: 1.21(rounded)
As of  10-01-19
Updated Monthly

PE10 as report by Multpl.com
DCA is Dollar Cost Averaging.
Lump Sum any amount greater than yearly salary.

PE10  ..........30.28
Bond Rate....3.01%

Over a ten-year period the typical excess of stock earnings power over bond interest may aggregate 4/3 of the price paid. This figure is sufficient to provide a very real margin of safety--which, under favorable conditions, will prevent or minimize a loss......If the purchases are made at the average level of the market over a span of years, the prices paid should carry with them assurance of an adequate margin of safety.  The danger to investors lies in concentrating their purchases in the upper levels of the market.....

Common Sense Investing:
The Papers of Benjamin Graham
Benjamin Graham
%
Stock & Bonds
Allocation Formula
11-01-19
Updated Monthly

% Allocation = 100 – [100 x (Current PE10 – Avg. PE10 / 4)  /  (Avg.PE10 x 2 – Avg. PE10 / 2)]


% Stock Allocation    0% (rounded)
% Bond Allocation 100% (rounded) 

Logic behind this approach:
--As the stock market becomes more expensive, a conservative investor's stock allocation should go down. The rationale recognizes the reduced expected future returns for stocks, and the increasing risk. 
--The formula acknowledges the increased likelihood of the market falling from current levels based on historical valuation levels and regression to the mean, rather than from volatility. Many agree this is the key to value investing.  
Please note there is controversy regarding the divisor (Avg. PE10).  The average since 1881 as reported by Multpl.com is 16.70.  However, Larry Swedroe and others believe that using a revised Shiller P/E mean of 19.6 , the number since 1960 ( a 53-year period), reflects more modern accounting procedures.


DYI adheres to the long view where over time the legacy (prior 1959) values will be absorbed into the average.  Also it can be said with just as much vigor the last 25 years corporate America has been noted for accounting irregularities.  So....If you use the higher or lower number, or average them, you'll be within the guide posts of value.

Please note:  I changed the formula when the Shiller PE10 is trading at it's mean stocks and bonds will be at 50% - 50% representing Ben Graham's Defensive investor starting point; only deviating from that norm as valuations rise or fall.        
  
DYI


This blog site is not a registered financial advisor, broker or securities dealer and The Dividend Yield Investor is not responsible for what you do with your money.
This site strives for the highest standards of accuracy; however ERRORS AND OMISSIONS ARE ACCEPTED!
The Dividend Yield Investor is a blog site for entertainment and educational purposes ONLY.
The Dividend Yield Investor shall not be held liable for any loss and/or damages from the information herein.
Use this site at your own risk.

PAST PERFORMANCE IS NO GUARANTEE OF FUTURE RESULTS.

The Formula.