Monday, February 3, 2020

Secular Top
Investment Report
[Let’s Party its 1929!] 

Image result for shiller pe chart pictures
As of 2/3/20
30.84

From High to Low - Since Year 2000

+446.6% Gold
+254.9% Transports
+231.1% Utilities
+145.8% Dow
+124.9% Nasdaq
+119.5S&P 500
+101.4% Oil 
+  69.0% 30yr Treasury Bonds
+  64.0% Swiss Franc's

December 1999 Shiller PE10 was 44.19               
August 2000 S&P 500 dividend yield was 1.11% 


DYI:
The Federal Reserve has once again turned on the money supply pumping up to market to new highs.  Since the secular top in the year 2000 the NASDAQ has moved up two notches outperforming the S&P 500.  Interest sensitive stocks moved up in performance from last month [didn’t change places in the overall performance derby] especially utilities with a nice pop to the upside highlighting the fact that the Fed’s want to keep on partying like its 1929! 
    
This Will Not End Well

For those holding or purchasing stocks today going to sleep like Rip Van Winkle waking 10 years from now will expect an estimated average annual return of – drum roll please - +0.13!  Yep that’s it for all of your toil and troubles as a buy and hold type of guy or gal!

Let’s not confuse dollar cost averaging as that return will be an average return over many years.  Dollar cost averaging [DCA] is nothing less than cleverly disguised small lump sums generally twice monthly for those with 401k type plans.  Depending upon the valuation level of the market and the size of the deposit at that time will determine your overall averaged return. 

When the 401k provider arrive entertaining you their dog and pony show they will always say it’s not timing the market [DYI are not speculators] but time in the market.  Back to Money Chimp and now plug in 20 years – drum roll please – 3.41%!  Wow a 2,523% increase in rate of return!  That is based on a relative basis between those two numbers however on an absolute basis a 3.41% return will only have you eating Alpo dog food in retirement!  So yes longer the time in the stock market greater your return.

Of course how long is the question? 

Just for fun going out 40 years – drum roll please – 5.09% an increase of 49%.  That’s an improvement moving your retirement years from having to eat Alpo dog food to chuck roast.  This is also an example of the law of diminishing returns when you go out 80 years [5.94%] the relative increase is now only 17%.  160 years??  Average annual return 6.37% or a relative increase from 80 years holding to 160 years of 7%!  So yes time in the market increases performance but relative to what and how long is always the question.

Active Asset Allocation

Four Uncorrelated Assets
1.)  Stocks
2.)  Long Term High Grade Corporate/Government Bonds
3.)  Short Term Notes (Cash)
4.)  Gold – Precious Metals Mining Companies

Four Assets Correlated to Four Economic Conditions
1.)  Prosperity
2.)  Deflation
3.)  Recession

4.)  Inflation

1.)  Prosperity: Stocks become a clear winner during conditions of increasing employment, rising wages tied to increasing productivity along with rising profits.  Junk bonds (they trade like stocks) are also winners in this environment despite their low quality; the economy is so good interest and principal payments are made – defaults are minimum – and a positive climate for refinancing.  High quality corporate/ government bonds are secondary winners as prosperity is noted for stable or slowly declining rates.  Gold is generally a loser in prosperity as inflation is minimized and investors seek higher returns in more traditional investments.


2.)  Deflation:  Deflation is the decease in the general price level of goods and services.  The Great Depression is a standout example of deflation.  The general cause is when excess debt is built up in the private sector that can no longer be increased and/or maintained resulting in massive bankruptcies.  This creates an environment of panic as businesses scramble to become profitable by firing employees and cutting hours of remaining workers.  In this deflationary episode interest rates decline, prices decline, and the almighty buck rises in value against softer currencies.

Long term high quality corporate bonds and long term U.S. government bonds are winners in this type of economy.  Stocks, gold, and junk bonds generally will fall in price along with interest rates on short term notes.

3.)  Recession:  For DYI's purposes recessions are a period of increasing interest rates engineered by the Federal Reserve in order to quell inflation by slowing down an over heating economy.  This condition is temporary as the economy will either adjust to the new economic environment bringing back prosperity or a deflationary period will begin.

High quality corporate/government bonds, stocks, gold, and junk bonds are all losers in this scenario. Short term notes and money market funds are clear winner as their principal value remains steady plus the interest income improves with increasing interest rates.

4.)  Inflation:  Too much money chasing too few goods.  When Federal government liabilities become onerous from financing of war(s) and/or social programs that are too great to be paid by taxation governments will resort to money creation to pay the remaining costs.  After WWII, Korea, Vietnam and the war on Poverty inflation began slowly prices increased relentlessly (despite high taxes) as government liabilities expanded.  When President Richard Nixon closed the gold window (1971) the last vestige of inflationary controls were removed with inflation peaking in the high teens only until Paul Volker was appointed as Fed Chairman (August 79) who crushed inflation with high interest rates.

Stocks, high quality long term corporate/government bonds, junk bonds are all losers as inflation soars along with interest rate increases (despite the Fed's efforts to suppress them).  Cash (money market funds) or short term notes are neutral or slightly lag inflation rolling up to the higher interest rate quickly.

Gold is a winner when inflation breaks above 5%.  When inflation goes double digit gold is marked up in price to reflect the debasement of the currency.  Gold will also rise in price based upon fear of massive defaults as gold has no counter party risk.

 VALUATIONS DO MATTER

This investment approach is an offshoot of Harry Browne's Permanent Portfolio that maintains a fixed 25% invested in the above four asset categories listed above.  Harry's uncorrelated assets at that time was ground breaking.  Today it is taken for granted.  As much as I was impressed with Harry's work it always made me uncomfortable to always own 25% in each asset. When valuations are at extreme lows a greater percentage is called for and conversely at historical nose bleed levels significantly less (or none).

DYI’s approach working through our four assets and determining with a measure of accuracy the percentage invested depending upon long term valuations.  This is done by calculating our averaging formula for each asset.

If all three assets - gold, stocks, long term bonds, cash is our default position - are at fair or average value then each of the categories will be at 25% of the portfolio just like Browne's Permanent Portfolio.  However as prices move up or down from their respective mean our averaging portfolio will make the adjustment enhancing the overall return. 

Will DYI outperform the market??

Our primary goal is to outperform the Permanent Portfolio first.  Outperform the market?  Maybe? DYI's intentions is a 6% real return - as opposed to Browne's 4% - into your pocket with low volatility as opposed to our fully invested stock market investor.  In closing each of these assets stocks, long term bonds, gold and cash, all have their moment of fame or shame.  Value players reduce or eliminate the overvalued assets and increase the undervalued; simple as that!  

 Updated Monthly

AGGRESSIVE PORTFOLIO - ACTIVE ALLOCATION - 2/1/20

Active Allocation Bands (excluding cash) 0% to 50%
50% - Cash -Short Term Bond Index - VBIRX
50% -Gold- Global Capital Cycles Fund - VGPMX **
 0% -Lt. Bonds- Long Term Bond Index - VBLTX
 0% -Stocks- Total Stock Market Index - VTSAX
[See Disclaimer]
** Vanguard's Global Capital Cycles Fund maintains 25%+ in precious metal equities the remainder are companies they believe will perform well during times of world wide stress or economic declines.  

 This blog site is not a registered financial advisor, broker or securities dealer and The Dividend Yield Investor is not responsible for what you do with your money.
This site strives for the highest standards of accuracy; however ERRORS AND OMISSIONS ARE ACCEPTED!
The Dividend Yield Investor is a blog site for entertainment and educational purposes ONLY.
The Dividend Yield Investor shall not be held liable for any loss and/or damages from the information herein.
Use this site at your own risk.

PAST PERFORMANCE IS NO GUARANTEE OF FUTURE RESULTS.
   DYI

Saturday, February 1, 2020

Updated Monthly

AGGRESSIVE PORTFOLIO - ACTIVE ALLOCATION - 2/1/20

Active Allocation Bands (excluding cash) 0% to 50%
50% - Cash -Short Term Bond Index - VBIRX
50% -Gold- Global Capital Cycles Fund - VGPMX **
 0% -Lt. Bonds- Long Term Bond Index - VBLTX
 0% -Stocks- Total Stock Market Index - VTSAX
[See Disclaimer]
** Vanguard's Global Capital Cycles Fund maintains 25%+ in precious metal equities the remainder are companies they believe will perform well during times of world wide stress or economic declines.  

 This blog site is not a registered financial advisor, broker or securities dealer and The Dividend Yield Investor is not responsible for what you do with your money.
This site strives for the highest standards of accuracy; however ERRORS AND OMISSIONS ARE ACCEPTED!
The Dividend Yield Investor is a blog site for entertainment and educational purposes ONLY.
The Dividend Yield Investor shall not be held liable for any loss and/or damages from the information herein.
Use this site at your own risk.

PAST PERFORMANCE IS NO GUARANTEE OF FUTURE RESULTS.

%
Stock & Bonds
Allocation Formula
2-1-20
Updated Monthly

% Allocation = 100 – [100 x (Current PE10 – Avg. PE10 / 4)  /  (Avg.PE10 x 2 – Avg. PE10 / 2)]


% Stock Allocation    0% (rounded)
% Bond Allocation 100% (rounded) 

Logic behind this approach:
--As the stock market becomes more expensive, a conservative investor's stock allocation should go down. The rationale recognizes the reduced expected future returns for stocks, and the increasing risk. 
--The formula acknowledges the increased likelihood of the market falling from current levels based on historical valuation levels and regression to the mean, rather than from volatility. Many agree this is the key to value investing.  
Please note there is controversy regarding the divisor (Avg. PE10).  The average since 1881 as reported by Multpl.com is 16.70.  However, Larry Swedroe and others believe that using a revised Shiller P/E mean of 19.6 , the number since 1960 ( a 53-year period), reflects more modern accounting procedures.


DYI adheres to the long view where over time the legacy (prior 1959) values will be absorbed into the average.  Also it can be said with just as much vigor the last 25 years corporate America has been noted for accounting irregularities.  So....If you use the higher or lower number, or average them, you'll be within the guide posts of value.

Please note:  I changed the formula when the Shiller PE10 is trading at it's mean stocks and bonds will be at 50% - 50% representing Ben Graham's Defensive investor starting point; only deviating from that norm as valuations rise or fall.        
  
DYI


This blog site is not a registered financial advisor, broker or securities dealer and The Dividend Yield Investor is not responsible for what you do with your money.
This site strives for the highest standards of accuracy; however ERRORS AND OMISSIONS ARE ACCEPTED!
The Dividend Yield Investor is a blog site for entertainment and educational purposes ONLY.
The Dividend Yield Investor shall not be held liable for any loss and/or damages from the information herein.
Use this site at your own risk.

PAST PERFORMANCE IS NO GUARANTEE OF FUTURE RESULTS.

The Formula.
DYI Comment:  As much as I admire Benjamin Graham if alive today would be awestruck by the Federal Reserve’s MASSIVE security market intervention.  Not just a U.S. phenomenon including world wide central banks insane money printing operations.  This has distorted security markets with their sub atomically low interest rates so much so fooling investors into thinking that current price/valuations to be reasonable.  Ben Graham’s formula is now very close for dollar cost averaging into common stocks!  Times are different as speculation – due to massive central bank distortions – is now the new investment process.      

Margin of Safety!

Central Concept of Investment for the purchase of Common Stocks.
"The danger to investors lies in concentrating their purchases in the upper levels of the market..."

Stocks compared to bonds:
Earnings Yield Coverage Ratio - [EYC Ratio]

EYC Ratio = 1/PE10 x 100 x 1.1 / Bond Rate
1.75 plus: Safe for large lump sums & DCA
1.30 plus: Safe for DCA

1.29 or less: Mid-Point - Hold stocks and purchase bonds.

1.00 or less: Sell stocks - Purchase Bonds

Current EYC Ratio: 1.27(rounded)
As of  2-1-20
Updated Monthly

PE10 as report by Multpl.com
DCA is Dollar Cost Averaging.
Lump Sum any amount greater than yearly salary.

PE10  ..........30.84
Bond Rate...2.80%

Over a ten-year period the typical excess of stock earnings power over bond interest may aggregate 4/3 of the price paid. This figure is sufficient to provide a very real margin of safety--which, under favorable conditions, will prevent or minimize a loss......If the purchases are made at the average level of the market over a span of years, the prices paid should carry with them assurance of an adequate margin of safety.  The danger to investors lies in concentrating their purchases in the upper levels of the market.....

Common Sense Investing:
The Papers of Benjamin Graham
Benjamin Graham

Friday, January 31, 2020

Bubble
News

More likely, assuming that market valuations simply touch their run-of-the-mill historical norms in the future, 

passive investors should be braced for zero or negative total returns both in the S&P 500 and in a conventional 60/30/10 asset mix over the coming 10-12 year horizon.

John Hussman

Whatever They’re Doing, It’s Not “Investment”

At the market open of Friday, January 24, our estimate of likely 12-year nominal total returns for a conventional passive investment portfolio (60% S&P 500, 30% Treasury bonds, 10% Treasury bills) fell to just 0.04% annually, below even the previous record of 0.34% set in August 1929. This extreme reflects the combination of record equity market valuations and depressed interest rates. That’s not an “equilibrium” situation. It’s a combination that joins insult with injury, creating weak prospects for the future returns of passive, diversified buy-and-hold strategies, across the board. 
Understand this. The more glorious this bubble becomes in hindsight, the more dismal future investment returns become in foresight. The higher the price investors pay for a set of future cash flows, the lower the return they will enjoy over time. Whatever they’re doing, it’s not “investment.” 
Amidst an “everything bubble” that has touched every asset class, I don’t believe that investors should imagine that there is some broadly appropriate investment that promises a satisfactory return despite such broad extremes. Even international stocks tend to lose significant value when U.S. stocks decline, regardless of their valuations. Yes, there may be niches that could be useful for diversification, but the primary “alternative” that investors have here, in my view, is cash, patience, and hedged investment exposure.
 Thanks John
DYI

Friday, January 24, 2020

Bubble
News

‘Peak Greed’ Fuels Record Junk Bond Sales in Europe

High-yield borrowers are following in the footsteps of Europe’s investment-grade market, which has also seen a record-breaking flurry of bond issuance this year. For now though, syndicate bankers are still testing the waters in Europe’s high-yield market. Most of the deals so far have been from issuers with well-known capital structures, said Andrey Kuznetsov, senior credit portfolio Manager at Hermes Investment Management.

Germany Limiting the Ability to Anonymously Purchase Gold in an Attempt to Force People to Hold Euros

Two years ago people in Germany could anonymously purchase EUR 15,000 of gold, then the limit dropped to EUR 10,000, and now the limit will drop to only EUR 2,000 as of January 10. Anyone who purchases more than the EUR 2,000 limit will have to go through an intensive know your customer (KYC) process and a criminal background check.

Germany, which is the most powerful member of the European Union, is claiming that they are limiting anonymous gold purchases in order to prevent money laundering. However, the drastic reduction of anonymous gold purchase limits coincides with increasingly negative interest rates in the European Union.

Essentially, people who save money in banks are charged to hold their money, which is basically the opposite of savings. In order to avoid this people can buy gold, but now the European Union is clamping down on gold in order to force people to keep their money invested in Euros.
Basically, the European Union is taking away the freedom to divert money into safe haven assets, and increasingly forcing people to hold the Euro against their will. This may be an omen of what is to come as fiat currencies continue to lose value worldwide due to crashing Central Bank interest rates and mass money printing.

Head of U.S.’ largest bank says central banks are fueling a sovereign debt bubble, negative-rates won’t ‘end well’


Moody’s Investors Service warned Thursday that default risk is on the rise for the nearly $1.2 trillion of speculative-grade loans, bonds and various related instruments maturing from 2020-24. That total is a record for maturities coming due over a five-year period, up 14% from 2019.

While low interest rates have allowed spec-rated companies to continue to roll over all that paper, a slowdown in the economy or a reversal in Federal Reserve monetary policy could pose problems.

Senator Bernie Sanders has come closer than anyone on the Presidential campaign trail in defining what Wall Street actually does. Sanders has repeatedly stated at his rallies that “the business model of Wall Street is fraud.”
That analysis is correct but abbreviated. Sanders needs to go further. It’s not just Wall Street’s business model that has left the United States with the greatest wealth inequality since the Roaring Twenties (a time when Wall Street investment banks were also allowed to own deposit-taking banks). It’s how Wall Street is monetizing that fraud that poses an existential threat to the solvency of the United States and the impoverishment of millions of Americans.
As a sign of just how brazen and disastrously broken the U.S. financial system has become, with no hearings in Congress, with no blaring headlines on the front pages of newspapers, the New York Fed turned on its money spigot to Wall Street again on September 17, 2019. It was the first time this has happened since the financial crisis.
 For the past four months the New York Fed has been spewing hundreds of billions of dollars each week to Wall Street’s trading houses, pushing the Dow Jones Industrial Average up by 3,000 points, with no accountability to anyone or explanation as to why Wall Street needs or deserves this money.
DYI:
This is the most insane period of time for stocks and bonds on a world wide basis.  Central banks have lost their minds with all of this money printing jacking up securities prices to the heavens changing the landscape from investing to a gambling parlor.  This will not end well.  Of course the question is when??  I don’t know and no one does either.  At these levels sooner rather than later but to define sooner or later I’ll admit I’m stumped!  The U.S. market overvalued since 2012 and now has climbed to levels of absurdity.  The only two areas of reasonable value is cash [short term bills and notes] plus precious metals – gold and silver – and their respective mining companies. 
Updated Monthly

AGGRESSIVE PORTFOLIO - ACTIVE ALLOCATION - 1/1/20

Active Allocation Bands (excluding cash) 0% to 50%
50% - Cash -Short Term Bond Index - VBIRX
50% -Gold- Global Capital Cycles Fund - VGPMX **
 0% -Lt. Bonds- Long Term Bond Index - VBLTX
 0% -Stocks- Total Stock Market Index - VTSAX
[See Disclaimer]
** Vanguard's Global Capital Cycles Fund maintains 25%+ in precious metal equities the remainder are companies they believe will perform well during times of world wide stress or economic declines.  

 This blog site is not a registered financial advisor, broker or securities dealer and The Dividend Yield Investor is not responsible for what you do with your money.
This site strives for the highest standards of accuracy; however ERRORS AND OMISSIONS ARE ACCEPTED!
The Dividend Yield Investor is a blog site for entertainment and educational purposes ONLY.
The Dividend Yield Investor shall not be held liable for any loss and/or damages from the information herein.
Use this site at your own risk.

PAST PERFORMANCE IS NO GUARANTEE OF FUTURE RESULTS.
DYI
Saturday, January 18, 2020


Never

Forget

J. Paul Getty Quote!
Stock Market - "For as long as I can remember; veteran businessmen and investors - I among them - have been warning about the dangers of irrational stock speculation and hammering away at the theme that stock certificates are deeds of ownership and not betting slips.

The professional investor has no choice but to sit by quietly while the mob has its day, until enthusiasm or panic of the speculators and non-professionals has been spent. He is not impatient, nor is he even in a very great hurry, for he is an investor, not a gambler or a speculator. There are no safeguards that can protect the emotional investor from himself."

DYI: 

This blogger has been involved as an investor for 45 years – since the age of 20 – yep that’s right I’m 65 years old.  What we have today is an overblown stock market since 2012 when it achieved the 1966 valuations; around 2016 broke through the 1929 high and possibly will assault the 2000 valuation top!    
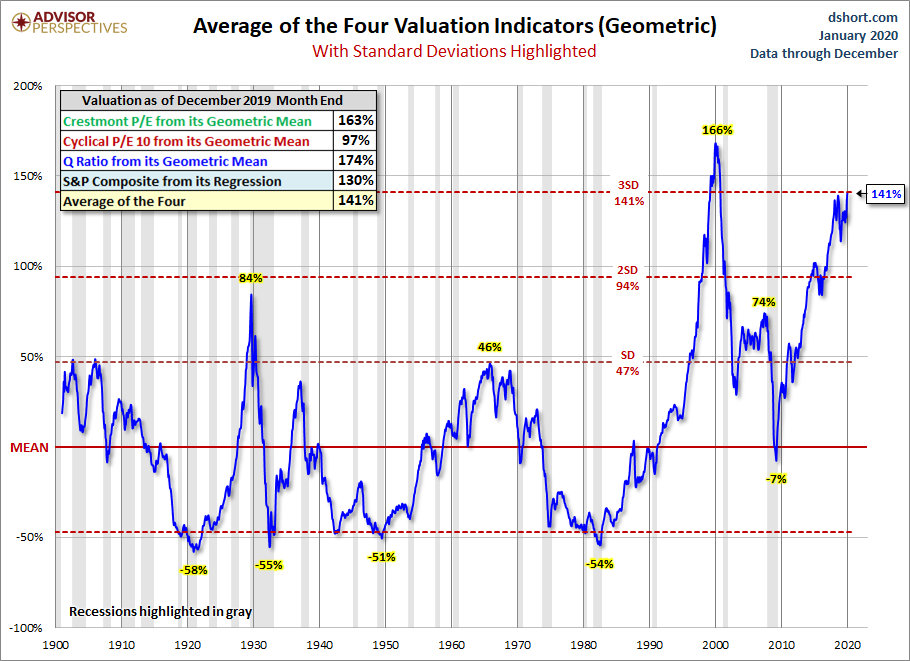
Geometric Standard Deviation Average

To be blunt this is a terrible time to invest in U.S. stocks! 
Take a look at the chart below highlighting previous market tops with their subsequent 10 year returns.     

Purchasing or holding stocks at these valuation levels should expect a negative return over the next 10 years.  What to expect for a 20 year holding period?  Let’s go to money chimp – [they do all the math] – placing in today’s Shiller PE of 32 along with our sub atomic low dividend yield of 1.75% your estimated average annual return before any expenses is…drum roll please…3.22%!  Hope does spring eternal for at least the return starting out is positive.  But alas most 401k’s have a 1% management fee throw in 0.50% for trading impact cost and of course our ever present inflation around 2%.  Add this all up equals 3.50% and lo and behold you are back to a negative return.
The bond rally of lifetime has played itself out.
10-year Yield Log Scale
There may remain speculative sauce furthering the bond rally of a lifetime as another recession is sure to arrive again.  However it does not take a genius to figure out with yields topping out at 15% in 1981 and trading under 2% today the bond rally of a lifetime has essentially played itself out.  After all of those pesky costs including inflation the real return over the next 10 or 20 years will highly likely be negative!
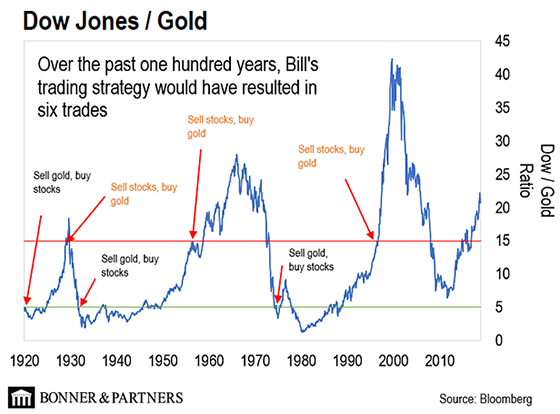
The Dow/Gold Ratio
Precious metals and their mining companies remain reasonably priced.
  Image result for dow/gold ratio chart pictures
As of 1/17/20
Dow/Gold Ratio
19 to 1
  Updated Monthly

AGGRESSIVE PORTFOLIO - ACTIVE ALLOCATION - 1/1/20

Active Allocation Bands (excluding cash) 0% to 50%
50% - Cash -Short Term Bond Index - VBIRX
50% -Gold- Global Capital Cycles Fund - VGPMX **
 0% -Lt. Bonds- Long Term Bond Index - VBLTX
 0% -Stocks- Total Stock Market Index - VTSAX
[See Disclaimer]
** Vanguard's Global Capital Cycles Fund maintains 25%+ in precious metal equities the remainder are companies they believe will perform well during times of world wide stress or economic declines.  
Image result for gold chart pictures
As J. Paul Getty stated so wisely stated stock and bond certificates are not betting slips; DYI is holding on to our cash and mining companies/ precious metals for the wild ride ahead since gold bottomed out late 2015! 
 DYI

Saturday, January 11, 2020


Globalization’s
Sinking Ship 

Image result for globalization hits a wall chart pictures

Gold's $1,500 level is 'looking like the new 2020 floor' - Scotiabank

“$1450 was the new hard floor but gold is now firmly in a spot where the risk/reward in being directionally short is not favorable -- $1500 is increasingly looking like the new 2020 floor…,” wrote Scotiabank commodity strategist Nicky Shiels last week.
For two generations, globalization and financialization have been the two engines of global growth and soaring assets. Globalization can mean many things, but its beating heart is the arbitraging of the labor of the powerless, and commodity, environmental and tax costs by the powerful to increase their profits and wealth. 
In other words, globalization is the result of those at the top of the wealth-power pyramid shifting capital around the world to exploit lower costs of labor, commodities, environmental regulations and taxes. 
As a result, the global economy and financial system are both running on the last toxic fumes of financialization and globalization, the final extremes of exploitation and predation as the pack of predators has exploded in size and influence while the herd of prey has been decimated. 
The prey always seem limitless to the predators, but this illusion expires when suddenly there is no longer enough for the ravenous pack of financial predators. 
At that point, the predators turn on each other. 
That is the narrative that will come to the fore in 2020 and play out in the decade ahead.
 DYI:
When the predators begin to turn on each other through nasty mergers and acquisitions that in turn will fail fighting over the remaining scrapes of the hollowed out middle class gold and silver will move up in price to reflect this new decade long dislocation. Stocks and corporate bonds will fall in value in a multiple cyclical manner.  U.S. government bills, notes and bonds will decline as well in a long drawn out saw tooth manner as the Federal Reserve fights this inevitable decline.  There is a possible one last hurrah left for declining rates breaking the 10 year T-bond yield of 1.37% [July 8, 2016] when our next recession arrives.  However that is speculation as rates are now so low relative to their historical mean.

Market Sentiment

Smart Money buys aggressively!
Capitulation
Despondency
Max-Pessimism *Market Bottoms* Short Term Bonds
Depression MMF

Hope Gold
Relief *Market returns to Mean*

Smart Money buys the Dips!
Optimism
Media Attention
Enthusiasm

Smart Money - Sells the Rallies!
Thrill
Greed
Delusional
Max-Optimism *Market Tops* U.S. Stocks
Denial of Problem Long Term Bonds
Anxiety
Fear
Desperation

Smart Money Buys Aggressively!
Capitulation
DYI