Friday, April 3, 2015

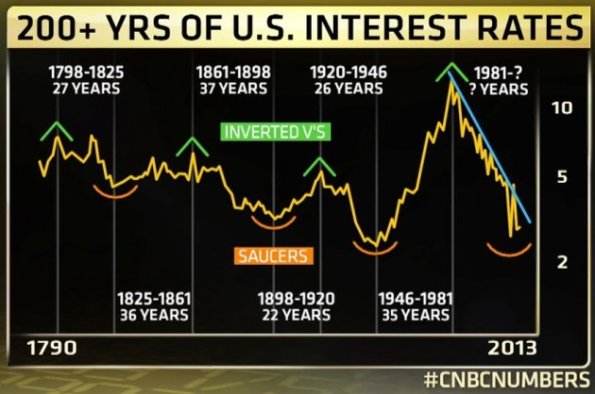
Current Price to Interest (10yr Treasuries) is 141% Above Average since 1871....Value Investor's Beware!

DYI Comments:  Current Price to Interest is now way above average.  Returns going forward returns will be dismal at best and losses when rates begin to move upwards.
YahooFinance_Louise-Yamadas-chart-of-222-years-of-interest-rates

Employment appears to be perking up a bit with early Boomers (ages 69-70) begin to retire is some measure of numbers.  They are postponing until late sixties or even seventy (max S.S. payment) as a group Boomer's are in bad shape financially with 1/3 flat broke.  Low/Inflation/ Deflation will continue until half of this generation is in retirement moving the country into a labor shortage in the years 2020 -2024.  A saving glut will continue with desperate Boomers who have the extra income to save forcing rates down along with world wide central banks battling the on going tepid economy.

For now long term bonds are not toxic.  Historically the bond rally of a lifetime that began in 1981 is very long in the tooth.  If you are in the accumulation stage it would be advised to slowly move into short term bonds/notes over the next 5 to 7 years.  For those who are retired it is a more difficult task as more money moves into short end (or CD's at the bank) when you do need money you may pull down your principal and once its gone its gone.  The only solution is to postpone taking S,S. at age 70 if possible and continue working possibly part time.  Unfortunately there is no easy solution.

The Semi-Retirement Myth

It’s no secret the baby boomers, not to mention the Gen Xers coming up fast behind them, are not in particularly great financial shape for retirement. Conferences on the topic abound—the National Institute on Retirement Security is hosting “Shaking Up Retirement: Rethinking Financial Security for Americans” this Tuesday in Washington, D.C. 
Pensions for people employed outside the public sector are vanishing. The defined-contribution plans that have replaced them aren’t cutting it. According to Fidelity Investments, the average 401(k) account belonging to someone at least 55 years old is worth $165,000. (And those people are lucky. They actually have workplace retirement accounts.) The Federal Reserve says the median amount held in all retirement accounts—individual or workplace—where the head of the household is at least 35 but hasn’t yet reached the official retirement age of 65 is $59,000.
DYI   

Monday, March 30, 2015

Bear markets happen more than people think: Since 1940 we have encountered 12 bear markets.


bear-markets-happen

It should be clear that bull runs do not last forever.  In fact, there seems to be a natural ebb and flow to the stock market.  We’ve had a very solid 6 year run and the fact that wages are still not keeping up with inflation, we know that something has to give.  Either stock market gains trickle down (unlikely) or a correction is bound to occur.  The market right now is fully hooked on the Fed’s easy money policy.  Any hint that the Fed may raise rates is met by sudden minor corrections.  At some point, the market is going to fully wake up and a bear market is likely to emerge.
DYI 

Professor Hussman tell's it like it is with a no holds barred insights as to the economy and financial assets. A must read for value driven investors!


John P. Hussman, Ph.D.

  • The U.S. has become a nation preoccupied with consumption over investment; outsourcing its jobs, hollowing out its middle class, and accumulating increasing debt burdens to do so.
  • U.S. wages and salaries have plunged to the lowest share of GDP in history, while the civilian labor force participation rate has dropped to levels not seen since the 1970’s. Yet consumption as a share of GDP is near a record high. This gap between income and expenses has been financed by debt accumulation, encouraged by the Federal Reserve’s policy of zero interest rates, and enabled by fiscal policies that prioritize income replacement rather than targeted spending and investment.
One of the central policy errors since the global financial crisis, and indeed since the collapse of the technology bubble after the 2000 market peak, has been the notion that economic problems caused by financial crisis must be fixed by financial means; monetary policy in particular. Unfortunately, this line of thinking has progressively weakened the U.S. economy, making it increasingly dependent on debt, encouraging the diversion of scarce savings to speculative purposes, promoting beggar-thy-neighbor monetary policies abroad that encourage the substitution of domestic jobs for cheaper foreign labor, and creating what is now the third U.S. equity valuation bubble in 15 years.
DYI 

Saturday, March 28, 2015

John J. Xenakis

Puerto Rico bankruptcy may be imminent, potentially a 'seminal event'

Marilyn Cohen, the CEO of Envision Capital Management, appeared on Bloomberg TV on Friday to analyze the debt situation in Puerto Rico. According to Cohen, a $70 billion bankruptcy in Puerto Rico is a virtual certainty, as early as July.Many people have invested in Puerto Rico bonds because they pay 10% interest (yields) and because under federal law they're "triple-tax free," meaning that you can earn 10% interest every year and not have to pay federal, state or municipal tax on the interest you collect. It's a sweet deal, provided that Puerto Rico doesn't go bankrupt, because if it does, then you lose most or all of your initial investment. 
According to Cohen, the unemployment rate is 13.7%. Only 700,000 of the 3.5 million people, or 20%, work in the private sector. The other 80% either are on welfare, or they receive unemployment or other aid, or they work for the government. Year after year, Puerto Rico sells more and more bonds, and investors eat them up because of the high tax-free yields. But now their string has run out. 
According to Cohen, the bankruptcy will hurt a lot of people. She compares it to the Detroit bankruptcy, which didn't really hurt too many people -- the bankrupt debt was $18 billion, but few ordinary people owned Detroit bonds, as most investors were institutions that hedged their purchases with credit default swaps. 
But Puerto Rico's debt totals $70 billion, and she says that huge numbers of ordinary investors are going to be hurt. Even if they don't individually own PR bonds, they own them through their 401k's or other investment funds, which have been boosting returns by purchasing the PR bonds. These funds will all lose significant principal in a PR bankruptcy. According to Cohen, this bankruptcy will be a "seminal event." 
After Detroit and Puerto Rico, Cohen says that the most likely next municipal bankruptcy will be Chicago, whose finances are "a mess."
DYI 

Thursday, March 26, 2015

The Big Four Economic Indicators: Real Retail Sales

Retail Sales fell again in February, down 0.58%, the third month of decline and substantially below estimates. The inflation-adjusted data, using the seasonally-adjusted Consumer Price Index, came in even worse at -0.80%. The chart below gives us a close look at the monthly data points in this series since 2009. I've included a linear regression to help us identify the trend.
 
DYI Comments:  Things are becoming interesting as the possibility of a recession call nears.  A global equity and junk bond bubble all that is needed is an event (recession?) for the pin to find the bubble and pop it.  Hold onto your hat and cash as better values are ahead of us.

The Great Wait Continues...
DYI

Wednesday, March 25, 2015

The Great Disconnect!
Currently today the U.S. stock and bond markets are at all time highs with valuations greater than prior market tops except for the year 2000.  And yet despite all of the happy talk the U.S. economy is nowhere near back to normal.

An economy on the mends?  Home ownership continues to drop precipitously.
  Presentation Homeownership Rate
The Labor Force Participation Rate.  So many of our citizens have simply given up looking for work dropping our headline unemployment so touted by our politicians.  The chart below is far more indicative of employment.
 Presentation Labor Force Participation Rate
Inactivity Rate for Working Age Men 25-54.  Since the end of the recession has increased from 10% to 12%.  If this goes any higher this will have severe societal implications.
 Presentation Inactivity Rate
 Real Medium Household Income.  Incomes are down from the year 2000 and hasn't shone any  positive upward trend.
Presentation Real Median Household Income
Inflation.  Prices are up 50% since the year 2000.  It is amazing that incomes have done as well as they have with this headwind.
Presentation Food Inflation
Government Social Benefits SNAP (food stamps).  So many on relief programs and no real sign of abatement.
Presentation Government Spending On Food Stamps
The Velocity of Money:  In a healthy economy money turns over quickly and yet continues to drop after the recession ended.
 Presentation Velocity Of M2
The Great Recession continues despite all the happy talk from the talking heads on TV the economy at best is trolling at the bottom, unfortunately this so called recovery is long in the tooth an upcoming recession should be anticipated.  Before things get better the odds favor them getting worse.

DYI 

Sunday, March 22, 2015


By: 
 Peter Schiff
Tuesday, March 10, 2015
With the economy now clearly losing steam, based on the drop in GDP from 3rd to 4th quarters, and general macro data coming in very weak (Zero Hedge, 2/18/15), I believe the Fed wants desperately to move those goalposts. But after a series of seemingly strong jobs reports, culminating with a strong 295,000 jobs in February, the market expects that "patient" will soon disappear from the statement. The Fed wants to comply, thereby signaling that everything is fine. But at the same time it doesn't want the markets to conclude that rate hikes are imminent when it does.

In other words, they are searching for a way to drop the word "patient" without communicating a loss of patience. What? This is like a driver telling other drivers that she plans on engaging her turn signal before making a left, but then wonders how to hit the blinker without actually creating an expectation that a turn is imminent. This seems to be a question for psychologists not bankers. Perhaps it is looking for a new word to replace "patient"? Something that implies a slightly less patient outlook, but that certainly does not imply imminence. "Casual" or "nonchalance" may fit the bill. How would the markets react to a "nonchalant" Fed? Time for a focus group. 
The business cycle tells us that recoveries do lose momentum over time. The current recovery is already five years old, and is, statistically speaking, already well past its prime. And since low rates encourage the economy to take on more debt, the longer the Fed waits to raise rates, the more debt we will have when it does. This means that the debt will be more costly to service when rates rise, which will throw even more cold water on the "recovery."

The Fed's real predicament is not how to raise rates, but how to talk about raising interest rates without ever having to actually raise them. If we had a real recovery, the Fed would not need to couch its language so delicately. It would have just pulled the trigger already. But when its communications and its intentions are different, credibility becomes a very delicate asset.

Yellen Sends Odds of Any Rate Increase Below 50% Until December

The likelihood that policy makers will lift their benchmark rate from near zero in September fell to 39 percent from 55 percent on Tuesday, according to calculations by Bloomberg using federal fund futures contracts. Futures traders have wiped out the chance of an increase in June, assigning it an 11 percent probability. 
Eurodollar futures, which are used to speculate on the path of the Fed’s policy rate, signal that traders estimate the policy rate reaching a peak rate of 1.93 percent by the end of 2018, down from 2.14 percent priced-in on Tuesday. Fed officials project the long-run policy rate at 3.75 percent.
DYI Comments:  DYI's time line for debt deleveraging to conclude is five to seven years from now or around 2020 to 2022.  Only then will the Fed's move to reduce their balance sheet and allow rates to move upward in any meaningful fashion.  The nosedive in commodity prices has deflationary implications which will stretch out our central bank time line for raising rates including many other central banks, as exampled European Central Bank, Bank of Canada, Bank of England, and Bank of Japan.  On balance there is significant pressure for rates to stay low or decline for years to come.

It is unfortunate that with sub atomic low interest rates our ability to generated profits in the securities markets has been hampered significantly.  Institutions and citizens alike now have a zeal for yield mentality (desperation) and have "jacked up" prices way beyond their historical averages.  It is now nothing more than a speculator's market for the past two years.  So far the speculators are the winners with the value players appearing to be out of step.  The old expression, "they don't ring a bell when the market tops."  Not to worry these gains of the last two years will be transitory as any value player will point out (that bell has been ringing for two years).  The return of your capital today is far more important than the return on your money.

AGGRESSIVE PORTFOLIO - ACTIVE ALLOCATION -  3/1/15

Active Allocation Bands (excluding cash) 0% to 60%
85% - Cash -Short Term Bond Index - VBIRX
15% -Gold- Precious Metals & Mining - VGPMX
 0% -Lt. Bonds- Long Term Bond Index - VBLTX
 0% -Stocks- Total Stock Market Index - VTSAX
 0%-REIT's- REIT Index Fund - VGSLX
[See Disclaimer]

DYI

Tuesday, March 17, 2015

Nowhere to Hide!


John P. Hussman, Ph.D.
Whether or not it is fully appreciated, we are observing extremes in nearly every pendulum of the global financial markets. The situation is likely to be seen in hindsight as one of the broadest points of financial distortion in history. Broadest, because unlike the 2000 peak when technology and large capitalization stocks were more overvalued on reliable measures than they are today.
The median stock price is now more overvalued than in the year 2000.
It’s true that on historically reliable valuation measures that are best correlated with actual subsequent total returns on stocks, the 2000 peak remains the most overvalued point for the S&P 500 in U.S. history, though only about 20% above present valuation levels on those measures (there are certainly many popular but unreliable measures that suggest only moderate overvaluation here). Aside from that 2000 peak, the S&P 500 itself is now more overvalued than at the 1929 peak, not to mention the lesser 1972, 1987 and 2007 extremes. We estimate that the S&P 500 Index is likely to be below its present level a decade from now, though adding dividends is likely to raise the nominal total return to about 1.6% annually on a 10-year horizon.
DYI's  

Estimated 10yr return on Stocks

Using 5.4% as the historical growth rate of dividends and 4.0% as the ending yield.

Starting Yield*---------return**
1.0%-----------------------(-5.7%)
1.5%-----------------------(-1.7%) 

2.0%------------------------1.3%  You are Here!

2.5%------------------------3.8%

3.0%------------------------5.9%
3.5%------------------------7.8%
4.0%------------------------9.4%
4.5%-----------------------10.9%

5.0%-----------------------12.3%
5.5%-----------------------13.6%
6.0%-----------------------14.8%
6.5%-----------------------15.9%

7.0%-----------------------17.0%
7.5%-----------------------18.0%
8.0%-----------------------19.0%

*Starting dividend yield of the S&P500-**10yr estimated average annual rate of return.


Market indicators suggesting a correction is coming: On Black Tuesday Shiller PE Ratio was at 30. Today it is at 26.2 and volatility is back in a big way.

Stocks are incredibly overvalued based on earnings.  While companies like Amazon and Apple blow it out of the water, many others are not.  The current PE ratio is inflated. 
When you evaluate a company looking at price-to-earnings is important.  How much are you willing to pay to get a dollar back?  In essence that is what we are looking at with the PE ratio and right now we are looking frothy:
snp 500
baltic dry index
What this is signifying to us is that the demand to ship goods is low thus pushing prices lower.  The last time we saw a crash like this we ended up with the Great Recession.  Take a look at oil prices:
oil
Oil has collapsed in the last few months alone.  Many were getting accustomed to $100 a barrel oil only to see it drop to $47 a barrel.  The big push for this is plenty of supply with moderating demand.  Then you have OPEC maintaining output to flush out high cost producers and gain market share.  Of course this hit is going to reflect in oil producing countries like Russia, Canada, and Venezuela.
Does any of this sound like a stable market?  Having a system addicted to perpetual debt is not a solution.  It is merely a temporary measure to allow the financial wizards to siphon off real production into their hands.  In housing you had Wall Street buy up many homes driving prices higher and rents higher only to suck away more income from working families.  How is that good?  This was subsidized by the Fed with their negative interest rate policies.  Again, nothing comes for free in this world. 
The S&P 500 has gone up 200 percent since 2009.  A correction is bound to happen and the amount of volatility hitting the system currently is bound to expose some cracks.
Continuing with Professor Hussman
Next, consider the bond market. Unlike 2000, when 10-year Treasury yields of 6.5% still offered somewhere to hide, the present environment offers bond yields to investors that are scarcely higher than 2% in the U.S., with German yields at negative levels even beyond a 5-year maturity. In recent years, yield-seeking speculation has encouraged record issuance of junk debt and “covenant lite” leveraged loans (loans to already highly-indebted borrowers). This is simply a different iteration of what we observed prior to the mortgage crisis, when the yield-seeking security of choice was mortgage debt, and Wall Street’s rush to create more “product” fueled a speculative housing boom as credit was extended to borrowers lacking durable creditworthiness. The current episode is likely to end just as badly, though even more concentrated on the equity market, as a primary object of speculation in recent years has been debt issuance for the purpose of leveraged buyouts and equity buybacks, all of which looks fine only while historically volatile corporate profit margins remain extended at cyclical extremes.
DYI Comment:  Here we go again....Another debt blow off; this time in the junk bond arena. Central bank inspired boom bust cycle.  With interest rates so low on high quality debt especially Treasury securities, there is nowhere to go to for a historically competitive return.  If you believe rates will be moving up soon don't bet on it.  Here is a chart from the Atlanta Fed forecasting GDP growth for Q1 of this year.
Evolution of Atlanta Fed GDPNow Real GDP Forecast
The GDPNow model forecast for real GDP growth (seasonally adjusted annual rate) in the first quarter of 2015 was 0.3 percent on March 17, down from 0.6 percent on March 12.

   Continuing with Professor Hussman
Again, it’s tempting to think about currencies in simplistic terms, assuming that the quantity of the currency is all that matters for valuation, and therefore that quantitative easing in Japan and Europe, coupled with less accommodative policy in the U.S., should result in unending depreciation in foreign currencies. Just as elevated equity valuations in recent years hasn’t prevented even further speculative extremes, we can’t rule out the possibility that investors will continue to act on a simplistic mindset that results in massive undervaluation of foreign currencies and overvaluation of the U.S. dollar on the foreign exchange markets. Rather, our assertion is that the deviations of prices from valuation norms mean something about subsequent returns, particularly over the complete cycle. Because the present extreme in the global financial markets couples extreme U.S. equity valuations with extreme overvaluation of the U.S. dollar, we view investment prospects for U.S. stocks as even worse from the standpoint of foreign speculators as they are for U.S. speculators (neither can aptly be considered investors at these valuations).
DYI Continues:  Three asset categories that have value for the long term investor.  One: Gold mining companies (Vanguard's Precious Metals & Mining Fund symbol VGPMX) that have been beaten down from peak to bottom around 70%.  A tremendous sell off.  Our model portfolio currently holds 15% as gold stocks have long term potential value, however they are no longer the great bargain of 1998 - 2002 time period.  Dow to Gold Ratio is pricey, as shown in the chart below.
  
Fred's Intelligent Bear Site brought to you by Fred Filskov. Public, private, and commercial distribution of this material is permitted as long as a link to this site is attached.

AGGRESSIVE PORTFOLIO - ACTIVE ALLOCATION -  3/1/15

Active Allocation Bands (excluding cash) 0% to 60%
85% - Cash -Short Term Bond Index - VBIRX
15% -Gold- Precious Metals & Mining - VGPMX
 0% -Lt. Bonds- Long Term Bond Index - VBLTX
 0% -Stocks- Total Stock Market Index - VTSAX
 0%-REIT's- REIT Index Fund - VGSLX
[See Disclaimer]

Two:  Oil/gas/service stocks have been beaten down as well and represent long term value.  Oil and gas prices could fall further as the world economy slows or possible outright recession.  Recommend dollar cost averaging only, to lower your cost basis. DYI's favorite, as might have guessed is Vanguard's Energy Fund symbol VGENX.

Three:  The Euro is now undervalued.  The current exchange rate is $1.06 to 1 Euro or almost parity. At the same time Vanguard's European Stock Index Fund symbol VEUSX has a 4.33% yield from dividends as compared to 1.90% for the S&P 500.  Higher dividend yield plus an undervalued currency.  I would only recommend dollar cost averaging as the Euro could drop further( only encouragement to buy more) and an overvalued U.S. stock market that very could bring down world wide markets (including Europe) again encouraging us to continue purchasing.

Tide turning in favour of European stocks after years of underperformance

Euro zone stocks at 50-year low vs US stocks -BoA-Merrill
* Euro STOXX 50 still needs 40 pct rally to reach 2007 peak
* Region offers a better risk-reward -JPMorgan
Happy Hunting 
DYI
Updated 3-17-15

THE DIVIDEND ROOM

Just as the name Dividend Yield Investor indicates is my affinity with dividends; for they have never gone out of style as far as I'm concerned.  In the end they are the real reason investors, as opposed to speculators, purchase quality companies with increasing dividends.  In my mind these are the true growth stocks.  As the dividend is increased over time so will the stock price. As the legendary Charles Dow has written:
"To know values is to know the meaning of the market.  And values, when applied to stocks, are determined in the end by the dividend yield."  
The Dividend Room is a new addition to my blog showing a list of high quality dividend paying stocks for your further study.  All picks are basic time tested value approach. All companies have a reasonable low level of debt for their respective industry and a low PE multiple. Of course a competitive dividend yield two times greater than the S&P 500 with a payout ratio less than 85% for utilities and all others less than 50%.  Also screened companies that have increased their dividends on a regular basis (the true growth stocks). Included is additional screens based upon the Benjamin Graham approach for the defensive investor.

Our attempt is to find ten high quality companies with a yield double that of the S&P 500.  Recommend selling when the dividend yield is less than the S&P 500.

Please note:  Companies that fall off the list are not necessarily companies gone bad they simply have risen in price or no longer represent the deepest value and/or highest dividend yield.

For diversification purposes recommend building up to 40 to 50 companies.

Yield     S&P 500 Dividend Yield 1.90%

             Oil/Gas/Service 
4.00%  Helmerich & Payne symbol HP   

             Industrial Metals & Minerals
7.40%  Alliance Resource Partners LP symbol ARLP

            Utilities
6.90% Companhia de Saneamento Basico symbol SBS
4.70%   Spectra Energy symbol SEP
4.30%   AGL Resources symbol GAS
4.30%   Empire District Electric symbol EDE
4.10%   SCANA Corp. symbol SCG
4.00%  Avista Corp. symbol AVA

             Tobacco Products
4.50%  Universal Corp. symbol UVV
           
DYI recommends that you use our stock allocation formula to arrive at your allocation of stocks to bonds.  Currently it is at 28% for stocks.  For your cash holdings Vanguard's Short Term Bond Index symbol VBIRX or for those in a high tax bracket Vanguard's Limited Term Tax Exempt VMLTX.

 This blog site is not a registered financial advisor, broker or securities dealer and The Dividend Yield Investor is not responsible for what you do with your money.
This site strives for the highest standards of accuracy; however ERRORS AND OMISSIONS ARE ACCEPTED!
The Dividend Yield Investor is a blog site for entertainment and educational purposes ONLY.
The Dividend Yield Investor shall not be held liable for any loss and/or damages from the information herein.
Use this site at your own risk.

PAST PERFORMANCE IS NO GUARANTEE OF FUTURE RESULTS.

Friday, March 13, 2015

Instead, the U.S. has now technically slipped into deflation for the first time since shortly after the Great Recession. Consumer prices as measured by the Labor Department fell 0.7 percent from December to January — the largest monthly drop since December 2008 — as the result of plunging gas prices. That left the Consumer Price Index down 0.1 percent from the previous year, the first such drop since October 2009. 
 
As they consider the timing of their first interest rate hike since 2006, Federal Reserve officials, including Fed Chair Janet Yellen, seem to agree. In her testimony before Congress this week, Yellen noted that the Fed’s preferred measure of inflation continues to run below the 2 percent target rate. Yet the central bankers are looking beyond what they expect to be a short-term dip. 
“Despite the very low recent readings on actual inflation, inflation expectations as measured in a range of surveys of households and professional forecasters have thus far remained stable,” Yellen testified. “The [Federal Open Market] Committee expects inflation to decline further in the near term before rising gradually toward 2 percent over the medium term as the labor market improves further and the transitory effects of lower energy prices and other factors dissipate.”
DYI Comments:  The only notion that I have for the Fed's to raise rates providing room to drop rates when the next recession occurs.  Currently and for the next four or five years deflation or very low inflation will rule the day.  When Boomers retire in numbers soaking up unemployment until we go into a labor shortage.  Add on the costs of Medicare and Social Security the Fed's will relent to political pressure to monetize a portion of future borrowings. The 2020's will be marked by high taxes, high inflation, and a labor shortage.  Until then low inflation/deflation will rule the day.

DYI