December 19, 2016
John P. Hussman, Ph.D.
We presently observe the third most overvalued extreme in history based on the most reliable valuation measures we identify, in the presence of 1) the most extreme “overvalued, overbought, overbullish” syndrome we identify, and 2) explicitly deteriorating market internals. Based on a composite of measures best correlated with actual subsequent market returns across history, other two competing extremes were 1929 and 2000.
After more than three decades as a professional investor, it’s become clear that when investors are euphoric, they are incapable of recognizing euphoria itself.
Presently, we hear inexplicable assertions that somehow euphoria hasn’t taken hold. Yet in addition to the third greatest valuation extreme in history for the market, the single greatest valuation extreme for the median stock, and expectations for economic growth that are inconsistent with basic arithmetic, both the 4-week average of advisory bullishness and the bull-bear spread are higher today than at either the 2000 or 2007 market peaks. In the recent half-cycle, extreme bullish sentiment and deteriorating market internals also preceded the near-20% decline in 2011, yet extreme bullish sentiment was also uneventful on a few occasions when interest rates were in the single digits and market internals were intact. That distinction is critical. The zero-rate “solvent” that allowed overvalued, overbought, overbullish extremes to detach from deteriorating market internals and downside risk is now gone, and investors should understand that subtlety.
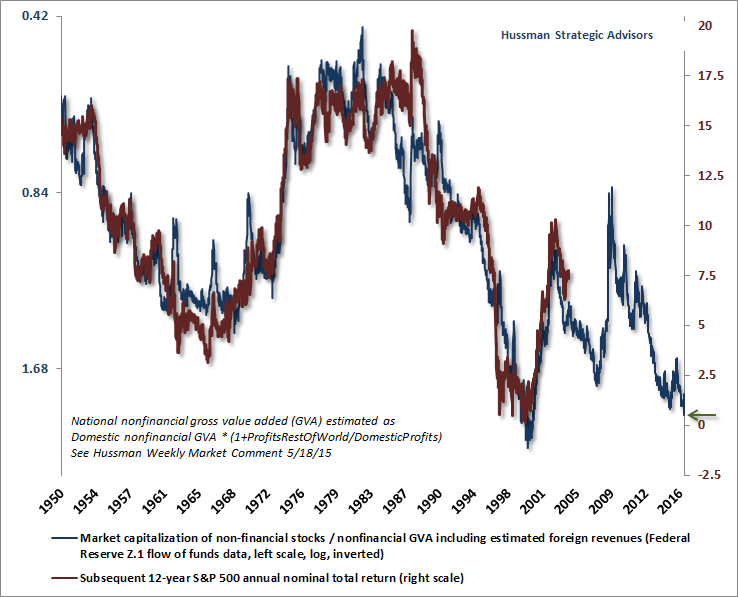
Over a century ago, Charles Dow wrote “To know values is to comprehend the meaning of movements in the market.” To offer a long-term and full-cycle perspective of current market conditions, I published a chart last week of the ratio of nonfinancial market capitalization to corporate gross value added, including estimated foreign revenues (what I’ve called MarketCap/GVA), and a second chart relating that measure to the actual 12-year S&P 500 total returns that have followed.
From present valuation extremes, we expect 12-year S&P 500 total returns averaging just 0.8% annually,
with a likely interim market collapse over the completion of this cycle on the order of 50-60%.
Valuations are poor tools to gauge near-term market outcomes, but they are both invaluable and brutally honest about potential consequences over the complete market cycle.
They also offer a consistent framework to understand market fluctuations. Recall for example, my April 2007 estimate of a 40% loss to fair-value, and then following that 40% loss, my late-October 2008 comment observing that stocks had become undervalued. Over the complete market cycle, valuation is quite a strong suit for us.
DYI
No comments:
Post a Comment