Bubble
News
The Crash In US Economic Fundamentals Is Accelerating
When looking at the health of an economic system it is impossible to gauge growth or stability by only taking two or three indicators into account. The problem is, this is exactly what central banks and governments tend to do. In fact, governments and central banks wildly and deliberately promote certain indicators as the signals everyone should care about while ignoring a whole host of other fundamentals that do not fit their “recovery” narrative. When these few chosen indicators don't read well either, they rig the numbers in their favor.
GDP rigging is mostly a government affair, as much of how GDP is calculated today includes government spending. So, even though the government has to steal your money through taxation in order to then spend money, government spending is still counted as “production”. This includes programs like Obamacare, which despite assumptions among some conservatives, continues to operate today. “Official” establishment estimates of government spending as a percentage of GDP stand at around 20%.
More accurate estimates accounting for ALL expenditures show that US government spending accounts for around 35% of GDP. This is an enormous fraud.
GDP
formula minus debt.
(New GDP - Old GDP) - (New Debt - Old Debt))
/ Old GDP = GDP
DYI: Classic of case of figures don’t
lie but statistics do! Remove government
borrowings DGP growth since the 1973 - 1974 recession a majority of the time has been
negative!
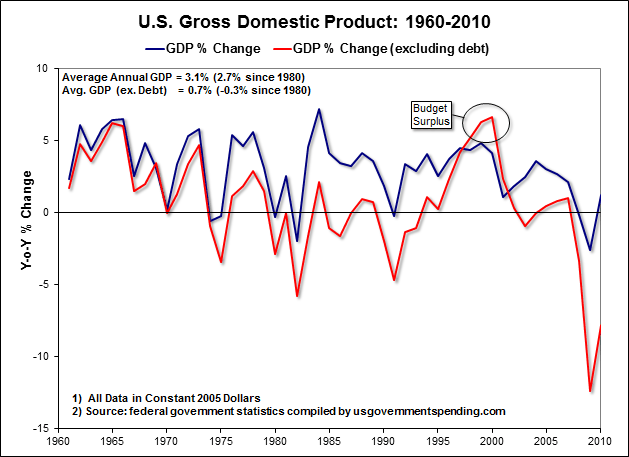
Since
2010 not much has changed with a majority of the time when debt growth is
removed growth is negative. Last year
[2018] the economy contracted by -2.43! when debt is removed.
206 million WORKING AGE
people
To clarify, 102 million WORKING AGE people (counted and not counted as unemployed) are jobless in the US.
This is almost 50% of the total 206 million working age people in the country.
Yet, the BLS reports the unemployment rate at an astonishing 4%. Recovery indeed...
Inflation rigging is a bit more complicated, but the primary method has been for the government and the Fed to simply change their methods of calculation over the past 4 decades, and to exclude inflation in certain goods like food and energy from the numbers. If you want to see real inflation numbers calculated the way they should be, visit John Williams over at Shadowstats.DYI: Shadow Stats 1980’s based methodology mirrors the Chapwood Index monitoring 500 products and services for major cities around the U.S. We’ve been oscillating from 7% to 10% inflation since the year 2000! Any wonder it is so hard to get ahead when every year you have a 7% thresh hold to leap over. Plus if your pay is only being increased by 2% or 3% constantly falling further and further behind.

Another issue that we must take into account is the Federal Reserve's role as a creator of financial bubbles, and the destroyer of financial bubbles.DYI: Unless you are new to this blog I’ve been reporting that the last 4 years stocks, corporate bonds especially high yield and junk plus real estate to a lessor degree are all in a massive bubble!
The Fed can and does act with impunity to influence the system, but they also seek to exploit certain economic indicators as a rationale for their policy decisions. For example, the Fed's QT policies have for the past couple of years relied on positive GDP, unemployment and inflation stats. In the meantime, the Fed has all but ignored the vast array of stagflationary and deflationary warning signs which run contrary to their interest rate hikes and balance sheet cuts.
Poor corporate earnings reports are the latest signal that we are entering (or returning to) a recessionary crash. But other signals have been visible for at least the past year. Corporate debt has hit historic highs once again, as companies sink into the red at levels not seen since 2007, just before the last economic disaster. This problem has been mostly dismissed in the mainstream economic media because companies were still reporting healthy profits, but now, as we've seen, profits are starting to falter. So, it is likely you will be hearing a lot more about massive corporate debt levels in the coming months. For now, the globalists at the IMF are preempting the disaster by “warning” about potential outcomes of corporate debt instability, just as they did before the 2008 crash (a little too late).
First, every time the Trump Admin injects the notion of a trade deal with China, it has consistently proven false, or exaggerated. My position is this - the trade war is an excellent distraction from the sabotage the Federal Reserve is initiating against the US economy as it pops the "Everything Bubble". This is why the trade war never seems to end. And, even if a trade deal is finally announced with China, I predict it will also be a farce, a fake deal which will result in no meaningful benefits to the US and one that will eventually fall apart.
Ultimately, as the current crash progresses the trade war will be blamed, rather than the central bankers that created the mess in the first place.
The bottom line is, the next crash has already begun. It started at the end of 2018, and is only becoming more pervasive with each passing month. This is not "doom and gloom" or "doom porn", this is simply the facts on the ground. While stock markets are still holding (for now), the rest of the system is breaking down right on schedule. The question now is, when will the mainstream media and the Fed finally acknowledge this is happening? I suspect, as in 2008, they will openly admit to the danger only when it is far too late for people to prepare for it.DYI: Brandon Smith at Alt-Market.com could very well be correct. So far stocks have peaked as measured by the S&P 500 on September 20, 2018. If stocks make an additional peak I would only see this as the last hurrah before the long awaited drop in prices.
DYI
No comments:
Post a Comment