For the entire rest of the stock market – all its winners and losers combined – minus the “Giant 5,” the period since January 2018 was a very rough and unpleasant ride to nowhere. It declined 1%. You would have been better off putting your money in one of those despicable freaking savings accounts:
“Wild Ride to Nowhere”:
APPL, MSFT, AMZN, GOOG, FB Soar to New High. Rest of Stock Market is a Dud, Has Been for Years
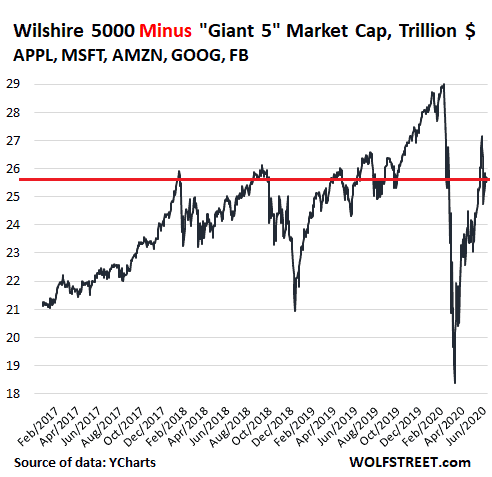

Subtrack the “Giant 5” and the US Stock Market Hasn’t Made Gains Since January 2018
Among the losers in that rest of the market are companies that used to be the largest in the US stock market, such as Exxon-Mobile, which since January 26, 2018, has lost 48% of its value. The entire and once vast oil-and-gas sector has gotten crushed.
The market, and broad portfolios, are immensely dependent on the Giant 5. That was great on the way up – on their way to becoming giants, when their share of the overall market doubled in three-and-a-half years, from 10% in January 2017 to nearly 20% today.
But if they sell off – there are myriad reasons why giants sell off, as all prior giants have found out – the impact of these five companies is going to be proportional to their giant size.
DYI: While stocks on a broad
basis continue their ongoing bear market there is one sector that I’ve
mentioned many times before; OIL! When
an investment class appears to be terminally ill as illustrated by Vanguard’s
Energy Fund symbol VGENX average annual return for the last ten years is – drum
roll please – negative -0.66%! This is
not a jab at Vanguard, all energy funds have had dismal returns over the last 10
years. However this industry – despite all
of the rhetoric – is NOT going into the dustbin of history. Contrarian thinkers know that nothing is
forever; energy companies’ stock prices are at bargain prices. Vanguard’s energy fund current yield – 4.81%
- is typical of many other energy based mutual funds.
Since the Year 2000
From High to Low - Since Year 2000
+ 521.7% Gold
+ 208.1% Transports
+ 170.9% Utilities
+ 124.5% Dow
+ 147.2% Nasdaq
+ 111.0% S&P 500
+ 78.4% 30yr Treasury Bonds
+ 147.2% Nasdaq
+ 111.0% S&P 500
+ 78.4% 30yr Treasury Bonds
+ 66.7% Swiss Franc's
+ 53.4% Oil
Easily seen the price
of oil compared to these vastly different asset categories has now reached the
bottom. Dollar cost averaging would be
the recommended way to go if you have this asset category in your 401k. If not go to Vanguard – or any fund group of
your choice – and begin purchasing shares directly.
Till Next Time
DYI
Disclaimer
This blog site is not a registered financial advisor, broker or securities dealer and The Dividend Yield Investor is not responsible for what you do with your money.
This site strives for the highest standards of accuracy; however ERRORS AND OMISSIONS ARE ACCEPTED!
The Dividend Yield Investor is a blog site for entertainment and educational purposes ONLY.
The Dividend Yield Investor shall not be held liable for any loss and/or damages from the information herein.
Use this site at your own risk.
PAST PERFORMANCE IS NO GUARANTEE OF FUTURE RESULTS.
No comments:
Post a Comment