The
Coming
Great Deflation
How Will The ‘GREAT DEFLATION’ Impact Gold & The Dollar?
While some aspects of monetary science and supply and demand forces do impact the prices of goods and services (on a short-term basis), the most important factor, ENERGY, is totally overlooked. You will never hear Peter Schiff include energy when he talks about the Federal Reserve, Commercial Banks, money printing or debt. Schiff, like most analysts, is stuck on studying superficial monetary data that does not get to the ROOT OF THE PROBLEM.
Furthermore, the majority of folks who believe in the Austrian School of economics, also fail to incorporate ENERGY into their analysis. For some strange reason, most analysts believe the world is run by the ENERGY TOOTH FAIRY (term by Louis Arnoux).
Without cheap and abundant energy, monetary science and supply-demand forces are worthless.
DYI Quick Comment: Spot on...a direct hit....Why is the U.S. in the Middle East? Oil & Gas! Why all the Russia rhetoric? Oil & Gas! If these other countries don't have oil and gas - such as Afghanistan - then its other natural resources and pipelines for oil & gas. Without energy American society will regress back 150 years plus!
That being said, as the debate on whether the world will experience, inflation, hyperinflation or deflation will continue to go on and on, I guarantee we are going to experience the MOTHER of all DEFLATIONS. Again, this will be due to the disintegrating energy sector and its inability to provide sufficent profitable net energy to the market.

The GREAT DEFLATION is coming due to the disintegration of the U.S. and global oil industry. As I mentioned in a precious article, the top three U.S. oil companies slashed their Q1 2017 capital expenditures (CAPEX) by 40%, versus the same period last year. Furthermore, the world only found 2.4 billion barrels of new oil in 2016 while it consumed 25 billion barrels:

I hate to be a broken record, but precious metals investors better WAKE UP. How many new barrels of oil do you think the global oil industry will find in 2017 as they continue to slash their CAPEX spending even greater than last year??
Investors need to understand how ENERGY and the FALLING EROI- Energy Returned On Investment, will impact the value of most assets going forward. Most assets will collapse in value, while a few will hold or gain in value. Gold and silver will be two of the few that will hold or gain in value during the GREAT DEFLATION.DYI: My oil indicator is updated once per month as oil price movements up or down significantly will change GDP dramatically up or down as well. This in turn will drive stock prices up or down as well.
5/1/17
Updated Monthly
Oil Prices: Updated Monthly
05/01/16....$37.04
05/01/17....$51.19
UP 38%(rounded)
(oil prices approximately one year earlier due to weekends & holidays)
ANS West Coast prices
UP 38%(rounded)
(oil prices approximately one year earlier due to weekends & holidays)
ANS West Coast prices
OIL INDICATOR: Negative Oil indicator will remain negative until it's rise is less than 10% from one year earlier.
Oil prices are well known for their volatility in the short term, longer term due to dwindling reserves energy prices are in a secular bull market. Technologies such as fracking will extend the life of oil fields but major new discoveries arrive at a snails pace far slower than the world's growth.
As long as prices rise in a slow and orderly pace our economy can adjust to those changes, however if prices spike (international tensions, war etc.) high energy costs behave as a massive deflationary tax. This will send our economy tumbling down and very possibly the U.S. stock market.
If oil prices rise greater than 75% from one year earlier, investors at that time should shift their portfolio geared towards deflationary times. This would be an oil indicator as negative.
If oil prices rise from one year-earlier less than 10% or drop then the inflationary play is in effect; a positive for economic growth along with possible higher stock prices.
Where to find one year-earlier oil prices? Alaska Department of Revenue
Oil indicator positive
20% REIT's
20% Energy
20% P.M.'s
40% Small Caps
0% Lt. Gov't Bonds
Oil indicator negative
5% REIT's
10% Energy
10% P.M's
10% Small Caps
65% Lt. Gov't Bonds
Vanguard Funds
REIT's
REIT Index Admiral VGSLX
Energy
Energy Fund VGENX
Precious Metals (P.M.'s)
Precious Metals and Mining Fund VGPMX
Small Caps
Small Cap Value Index Admiral VSIAX
Long Term Government Bonds
Long-Term Government Bond Index Admiral VLGSX
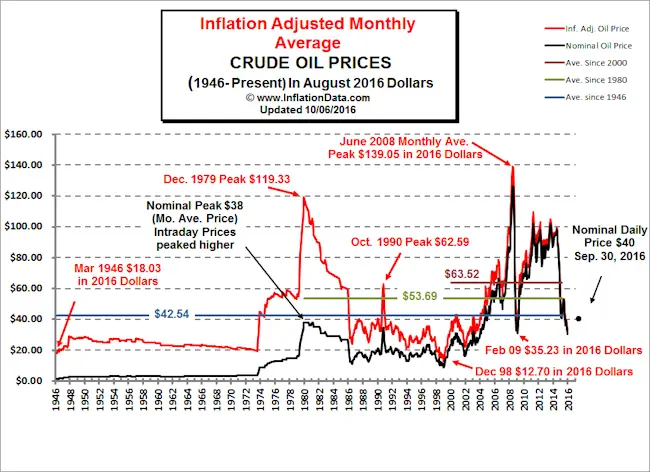
Lest we forget oil prices peaked at $139
dollars per barrel (2016 prices) knocking the socks off a real estate bubble
and stock market bubble during the 2008 – 2009 downturn.
Here we are again this time energy companies
have cut back substantially in developing new wells creating the possible price
spike for oil piercing the U.S. stock market bubble. Another deflationary smash is very possible
especially at these nose bleed valuation.
No comments:
Post a Comment