Bubble
Trouble
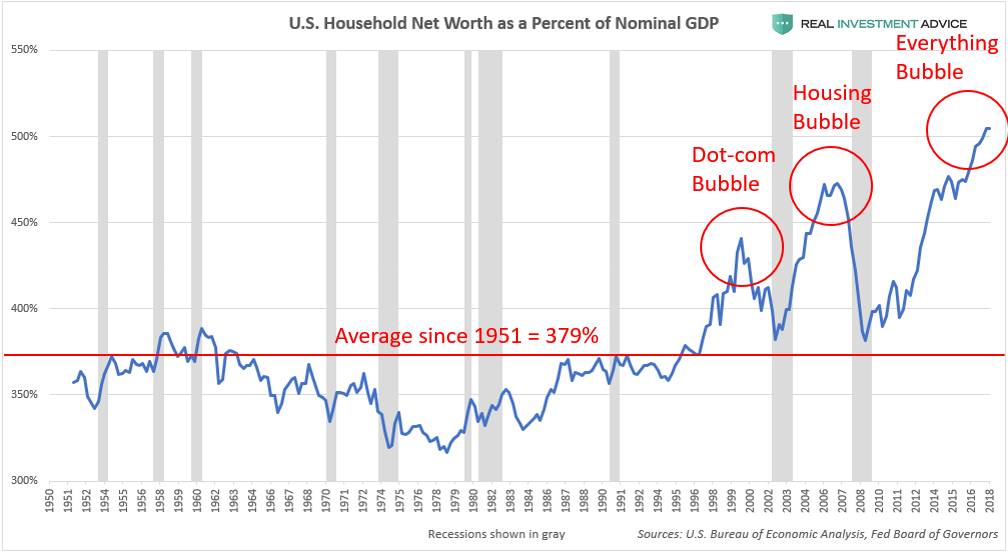
1979 bottom 325%...Dot-Com 429%...Housing 473%...Everything's a bubble 505%
Only 28% Of Americans Are “Financially Healthy” During The Largest Wealth Bubble
MarketWatch published a piece today called “Here is the ‘true state’ of Americans’ financial lives,” which stated that 42% of Americans have no retirement savings at all and that only 28% of Americans are considered “financially healthy.”
Unfortunately, this wealth boom is not a sustainable, permanent wealth increase, but an artificial, Fed-driven bubble that is going to burst with disastrous effects. If America’s personal financial health is this bad right now, just imagine how much worse it will be when our household wealth bubble bursts! (Yes, I know that the 28% who are considered “financially healthy” possess a disproportionate amount of America’s wealth that is currently inflated, but the bursting of this bubble will make these statistics even worse.)
DYI: The
chart above is an excellent valuation tool however it has zero predictive value
for when this economic/financial bubble rolls over. After 46 years studying markets I haven’t
found any reliable tools for determining market tops within a degree of
reasonable accuracy. Be as that may be;
it is highly illustrative the degree of massive overvaluation of all asset
categories. To create the mean
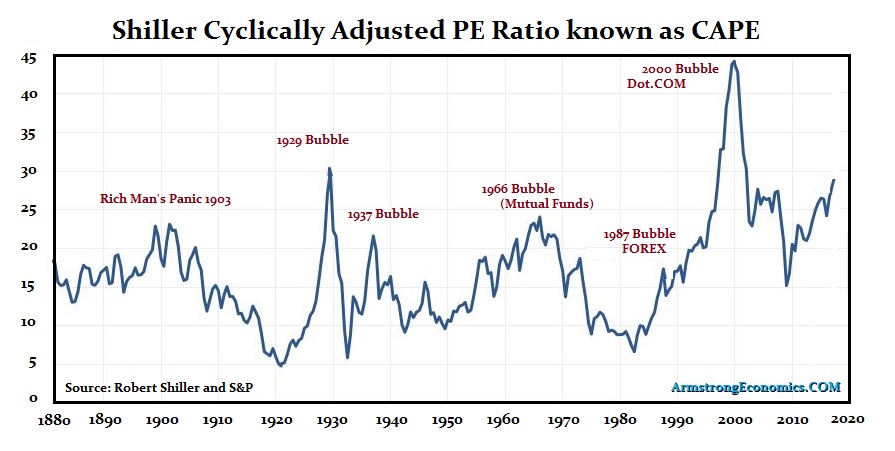
[average] valuations are required to be above and below thus its creation. Valuations are now 23 years above the
mean. When the rollover occurs – in a
zig zag manner – it is highly likely will bottom out below its mean from 325%
to 350% of GDP. That slide could very
well take two or three decades before completion.
All is Not Lost
The three primary asset drivers in a
capitalist society are stocks, bonds, and real estate. The speed or volatility to bottom out will
be first is stocks. Their prices can fly
all over even when the net worth to GDP is in a bull market. Being the most volatile bottoming out from
when they roll over is around – if history is any sort of guide – 12 to 18
years unless the U.S. experiences complete mismanagement of the economy then stocks will bottom out in 3 to 5 years as they did during The Great Depression.
Current [11/05/18] Shiller PE 30.70
High Yield bonds [BBB] or out right junk
bonds [C category] will be decimated.
Bonds of higher quality all the way up to AAA will sag in value finally reflecting
their risk to reward ratio regardless the direction of interest rates.
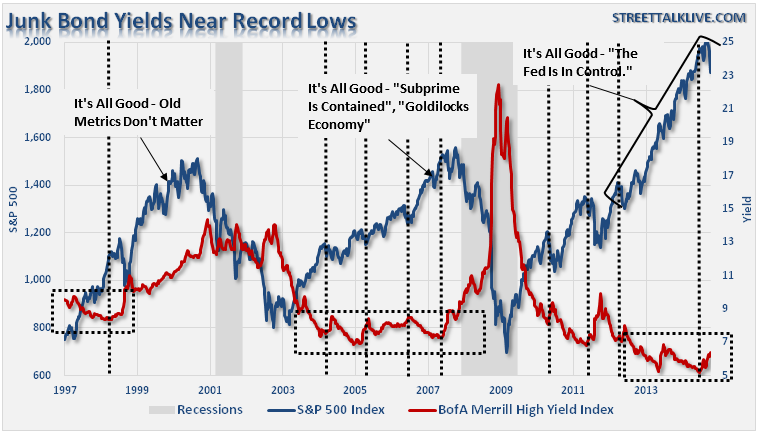
Vanguard's High Yield Fund [11/05/18] is 6.04%

Basic home ownership using median price to
median income homes are trading hands at 3.4 times income. Obviously if you are located near the Pacific
or Atlantic oceans this ratio will be much higher. At the bottom of the household net worth to
GDP homes will be under 2 to 1.0
DYI
No comments:
Post a Comment