Bubble
News
THE GLOBAL DEBT TICKING TIME-BOMB: The Reason To Own Gold & Silver
As Global Debt reached a new record high of $250 trillion this year, gold and silver came briefly back on the radar for investors. After five long years, the precious metals finally broke through key technical levels this summer. However, after the Fed started the Repo Operations in September and the $60 billion a month of “Not-QE” in October, the focus returned once again to the Bloated Stock and Bond markets.
DYI:
When
Dr. Pavlov rang the dinner bell for his dog it has now become the same when the
Fed’s ring the dinner QE bell conditioning market participants to gorge
themselves on stocks and bonds. However just
as the Japanese have experienced it takes on an ever expanding money supply to
maintain elevated markets. When this
ever growing bubble will burst is the unanswerable question. There will come a time when additional QE no
matter how massive will not stop a falling market. DYI’s secular peak to trough – [this may take
multiple cycles] – market drop estimation is 65% to 80%. That level of decline will bring stocks below
Shiller PE scale of ten. Thus returning
stock valuations to levels not seen since the late 1970’s!

As of 12/22/19
30.88
The U.S. economy isn’t even in a recession, and the Fed is acting as if it was 2008-2009 all over again. What happens when the U.S. economy finally rolls over?? It’s going to be terrible news, especially considering the record amount of global debt. According to the IIF, the Institute of International Finance, global debt reached a record high of $250 trillion in the first half of the year. However, the IIF estimates that global debt will reach $255 trillion by year end.
In just ten years since the 2008-2009 financial crisis, the world added another $100 trillion in debt. Now, the majority of that debt went into the Stock, Bond, and Real Estate Markets. This is precisely why the U.S. stock market has reached an all-time new high. Unfortunately, when the U.S. and the global economy finally enters into a recession-depression, the asset values will crash while the debts remain.
Total global debt will reach $255 trillion by the end of 2019 versus $3.4 trillion worth of gold and $90 billion in silver. Thus, the total world gold investment holdings are only 1.3% of the outstanding global debt, while world silver investment is a measly 2.6% that of gold.
When
the poop hits the fan market players will scramble for safe havens. Their top choice that has zero counter party
risk is physical gold and silver and after that will move to U.S. and Swiss
Treasury bonds.
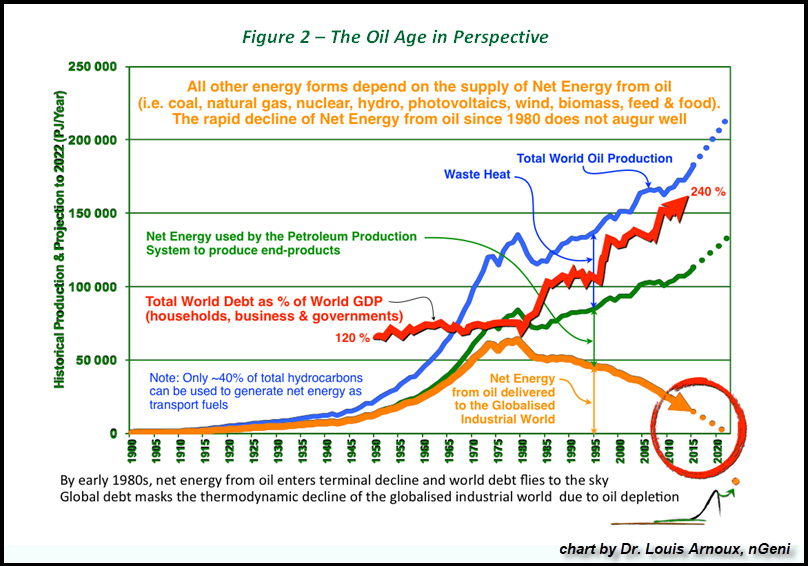
Currently, the massive Global Debt Time-Bomb isn’t impacting the values of the precious metals. This is because the mentality driving the market isn’t considering the FUTURE ENERGY needed to pay back all this debt. We must remember that Debt represents future obligations that can be paid back only when the global economy BURNS ENERGY.
This chart is very easy to understand. All one has to know is that as the NET ENERGY from oil delivered to the market (Orange line) has declined, the total World Debt to GDP (Red line) has increased. The data in the chart is a bit old, but the trend continues in the same direction. Based on the total global debt reaching $255 trillion by the end of 2019 and the estimated $88 trillion in world GDP, that equals a World Debt to GDP of 290%, much higher than the 240% shown in the chart. So, as you can see… the world continues to head towards the ENERGY CLIFF.
Simply
put there is no longer enough net energy from all sources to support this level
of debt. When this is recognized by the
majority on Wall Street the world wide markets will begin their declines. Of course at the expense of being repetitive
no one knows when that will happen.
(Bloomberg Opinion) -- It’s becoming increasingly apparent that the negative interest rates introduced in several countries in the wake of the global financial crisis are trashing bank profitability. Less obvious, though perhaps more crucial for society as a whole, are their debilitating impact on pension plans. And that’s why the days of sub-zero borrowing costs may be drawing to a close.
There’s nothing irrational, however, in fearing the economic consequences of keeping borrowing costs below zero for a sustained period of time. The emergency measures introduced to resuscitate growth, including central banks expanding their balance sheets by embarking on quantitative easing, were supposed to be transient. Instead, they’ve become fixtures of the economic firmament.
It’s been disastrous for pension plans. A 1% decline in interest rates increases calculated pension liabilities by about 20%. It reduces the funding ratio, which measures a pension provider’s ability to meet its future commitments, by about 10%. Those estimates come from a survey of 153 European pension providers with 1.9 trillion euros ($2.1 trillion) of assets sponsored by Amundi SA, Europe’s biggest asset manager, and published by Create-Research earlier this month.
Those low returns store up trouble for the future. It’s especially worrying as responsibility for putting aside retirement cash is increasingly transferred to individuals and away from companies and governments. Danish central bank Governor Lars Rhode went so far as to call the burden unacceptable:
“The task of bolstering the pension system to withstand pressures from lower rates and higher dependency ratios cannot be delegated to the individual pension saver,” he said earlier this month.

As of 12/23/19
S&P 500 dividend yield 1.78%
30 year T-bond is 2.34%
10 year T-bond is 1.92%

As of 12/23/19
Shiller Pe
30.88
I’ve
been reporting for years how our sub atomic low yields are destroying the remainder
of our old fashion pension plans. These
types of plans are primarily with our State and Local government employees that
are extremely unfunded and will eventually require retirees to take on significant
reduced benefits. For those who are
placed into the do it yourself category [with or without 401k’s] due to a such
sub atomic low return environment individuals today would have to put away 25%
of their income to foster some semblance of a retirement. Obvious that is not in the cards for the vast
majority.

With
the ever present decline in the purchasing power of the American dollar
[inflation] placing savers/investors behind the eight ball requiring returns
greater than the government ability to debase our currency. This is why I created my four asset category
model portfolio [for in depth explanation] that will over time react positively to any economic conditions.
No comments:
Post a Comment