Market
Update
DYI:
The
chart below is showing you the huge secular bull market move for stocks and
bonds are essentially finished. There is
a possibility of one last party for long term bonds as it is highly likely
during the next recession the Fed’s will move to negative interest rates. Be as that may be it is obvious historically
long term bonds and stocks are no bargain as valuations have leaped to the
heavens.


Stocks
are now 125% above their mean [see chart above]. What this
is telling us as a market valuation investor those holding or buying stocks now
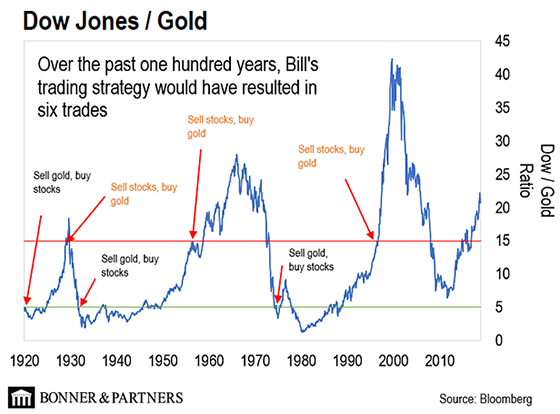
better be prepared over the coming years for massive losses. From secular peak to secular trough a case can
be made for a 60% to 85% decline due to such massive overvaluation [see chart below].


As of 12/13/19
$59.84
In
my mind what is holding up prices are two fold; massive or should I say
gargantuan Federal Reserve intervention AND reasonable energy prices.
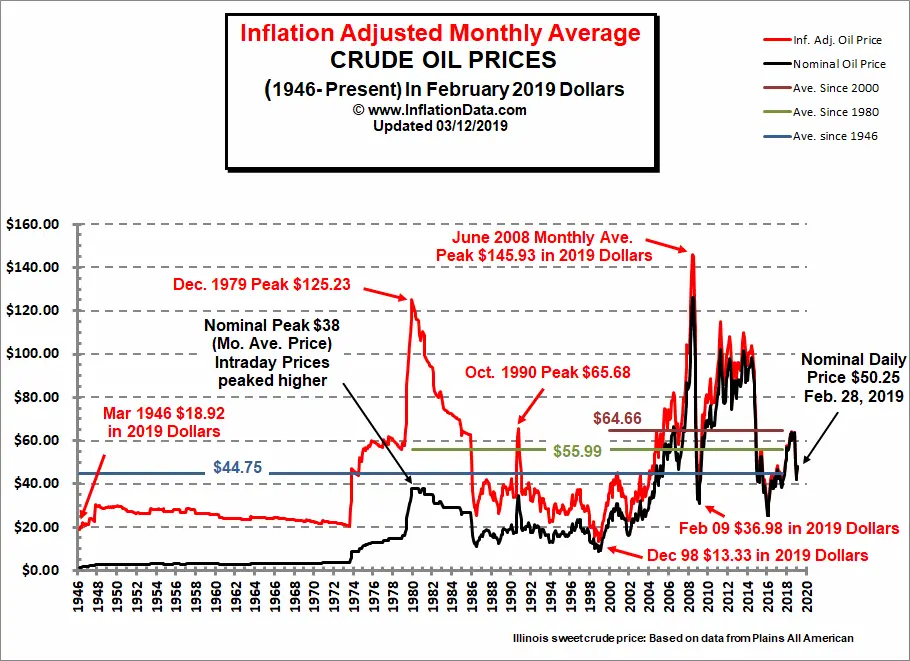
Oil Prices in Inflation Adjusted Terms
The major peaks occurred in December 1979 at $125.23, October 1990 at $65.68, and June 2008 at $145.93 (all inflation adjusted to 2019 dollars). Another interesting item to note is that the inflation adjusted average price has been increasing. The average for the entire period from 1946 to present is $44.75 but the average since 1980 is $55.99 and the the average since 2000 is $64.66. This may be the result of increased extraction costs as it becomes harder to find and requires much greater technology to extract oil.Energy prices and especially oil and its cousin gas have a huge impact on the economy with high prices acting as a tax slowing economic growth or possibly pushing into recession. Below is my Oil Indicator.
12/01/19
Updated Monthly
Oil Prices: 11/27/14.... $69.86
12/01/19......$65.72
Down 6%(rounded)
(oil prices approximately five years earlier due to weekends & holidays)
ANS West Coast prices
Down 6%(rounded)
(oil prices approximately five years earlier due to weekends & holidays)
ANS West Coast prices
OIL INDICATOR: Positive Oil indicator will remain positive until it's rise is greater than 75% from five years earlier.
Oil prices are well known for their volatility in the short term, longer term due to dwindling reserves energy prices are in a secular bull market. Technologies such as fracking will extend the life of oil fields but major new discoveries arrive at a snails pace far slower than the world's growth.
As long as prices rise in a slow and orderly pace our economy can adjust to those changes, however if prices spike (international tensions, war etc.) high energy costs behave as a massive deflationary tax. This will send our economy tumbling down and very possibly the U.S. stock market.
If oil prices rise greater than 75% from five years earlier, investors at that time should shift their portfolio geared towards deflationary times. This would be an oil indicator as negative.
If oil prices rise from five years earlier less than 10% or drop then the inflationary play is in effect; a positive for economic growth along with possible higher stock prices.
Where to find five year earlier oil prices? Alaska Department of Revenue
Oil indicator positive
5% High-Yield Corporate Bonds
10% REIT's
10% Energy
10% P.M.'s
65% Small Caps
0% Lt. Gov't Bonds
Oil indicator negative
5% REIT's
10% Energy
10% P.M's
10% Small Caps
65% Lt. Gov't Bonds
Vanguard Funds
REIT's
REIT Index Admiral VGSLX
Energy
Energy Fund VGENX
Precious Metals (P.M.'s)
Global Capital Cycles Fund VGPMX
Small Caps
Small Cap Value Index Admiral VSIAX
High-Yield Corporate Bonds
High-Yield Corporate Bond Fund VWEHX
Long Term Government Bonds
Long-Term Government Bond Index Admiral VLGSX
Stocks may continue to rocket ahead however they may soon run out of gas [sorry for the pun] as low oil prices lose their effect to power the economy. After that super high valuations will begin to feel their effect with stocks along with their respective valuation revert back to the mean.
If oil prices where to go back up [$100+] pushing the economy into a steep recession these super high valuations will bring down stocks in a great hurry with a one to two year horrific bear market. Anyway you look at it stocks and long term bonds are a poor investment currently for the long term investor.
All is not lost as DYI works through four asset categories. Stocks, long term bonds, precious metals [and their respective mining shares] and short term bills/notes [cash]. Thus providing an investor with at least one asset class being in a bull market at all time.
What I find amazing [I’m 65 years old] is how everything has gone full circle with during the 1970’s money market funds [or short term notes] were all the rage. Today the most unloved area and thus very undervalued is money market funds or short term bills and notes. The second best area is precious metals or their respective mining companies. This is best shown by my sentiment indicator for my asset categories.
Market Sentiment
CapitulationSo…This creates by using my averaging formulas DYI’s model portfolio.
Updated Monthly
AGGRESSIVE PORTFOLIO - ACTIVE ALLOCATION - 12/1/19
PAST PERFORMANCE IS NO GUARANTEE OF FUTURE RESULTS.
DYI
No comments:
Post a Comment