Gold
Bull or Bear
?
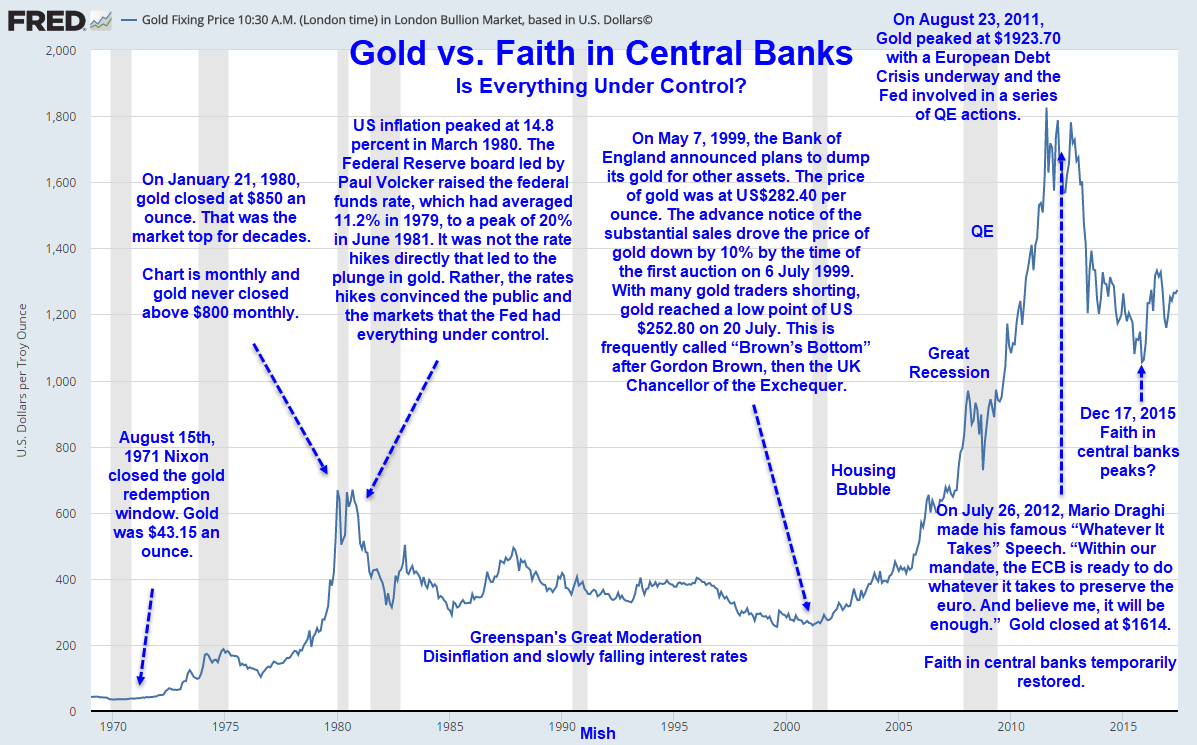

DYI: The biggest question for any type
of investment is its direction? Gold presently
has knock on the ceiling multiple times attempting to make new highs. Is this a continuation of gold’s bull market
that began December 16, 2015 at $1050 an ounce or going back into a bear
market? The unfortunate truth is that no
one knows for sure especially when historical valuations are very close to
their mean. So…Whether stocks, bonds, or
gold are trading around their mean or long term average valuation future prices
can easily move in either direction for longer than we care to admit.

Concentrating
on what we do know using DYI’s valuation driven averaging formulas gold or the
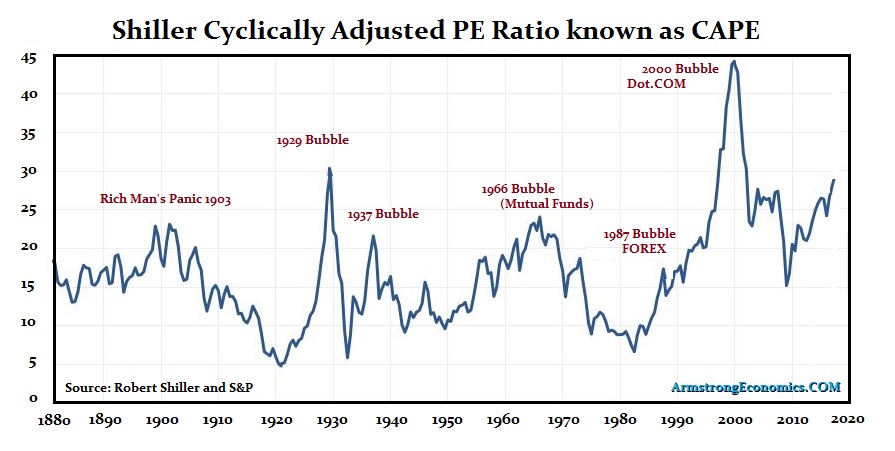
precious metals mining companies our model portfolio holds 32%. A slightly higher percentage as our mean is
calculated – as opposed to the above chart – since the inception of the Federal
Reserve. DYI’s mean is at 16 compared to
the above chart which looks to be around 22.
Hence by DYI’s judgment stocks as compared to gold are pricey giving us
a commitment slightly higher than the mean at 32% for gold.
AGGRESSIVE PORTFOLIO - ACTIVE ALLOCATION
Active Allocation Bands (Excluding Cash) 0% to 50%
68% - Cash -Short Term Bond Index - VBIRX
32% -Gold- Global Capital Cycles Fund - VGPMX
0% -Lt. Bonds- Long Term Bond Index - VBLTX
0% -Stocks- Total Stock Market Index Fund - VTSAX
[See Disclaimer]
As of 6/4/19
Shiller PE 28.87
Stocks
have been bid to very high levels actually higher than the 2000 top due to the
excessive distortion for any company in the S&P 500 with any high tech
pushing the Shiller PE to an insane level.
Today almost all stocks in the S&P 500 are at excessive levels far
outpacing the 2000 top. Going to MoneyChimp to calculate; placing your money into stocks today reinvesting dividends
going to sleep like Rip Van Winkle waking 10 years from now your estimated
average annual return is – drum roll please – 0.98%. If you are betting on stocks over the next
ten years to fund your retirement you better think twice. It simply isn’t going to happen starting at
these insane levels.
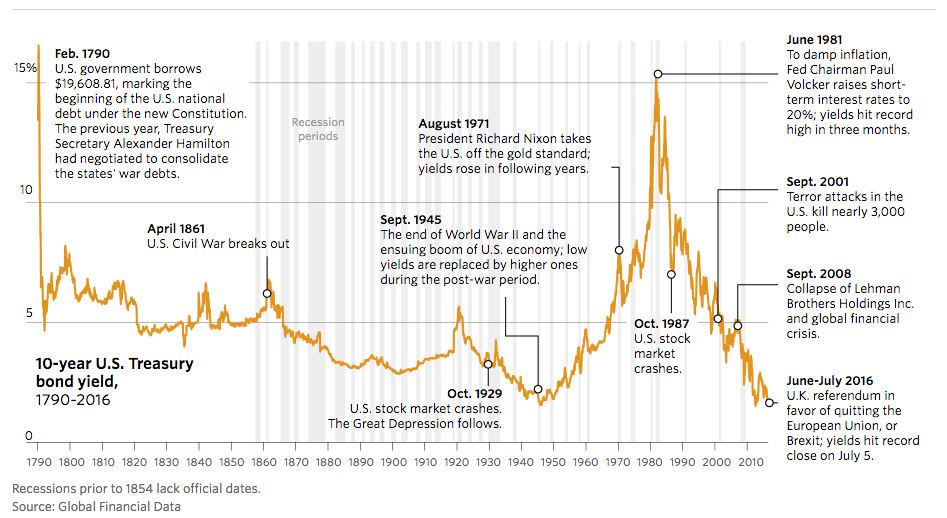
As of 6/4/19
19 year T-bonds
2.12%
Using
U.S. 10 year Treasury bond as our proxy; yields today are very low and appear
to once again on their way to subatomic levels.
To state the obvious compounding monies at these levels with the
downside risk of long term bonds are futile.
The days of shooting fish in barrel [high compounding rates of return]
in the late 1970’s and early 1980’s are long gone. The risk/return is now upside down with rates
so low. So…DYI model portfolio holds 68%
in short term notes waiting for improved valuations. Admittedly it’s been a long wait as the Fed’s
have once again pumped up a bubble for stocks plus bonds and are attempting to
keep it that way. But as we all know or
should know Mr. Market in the end will
have his way driving prices back to their mean and lower. When? No one knows. We can only wait!
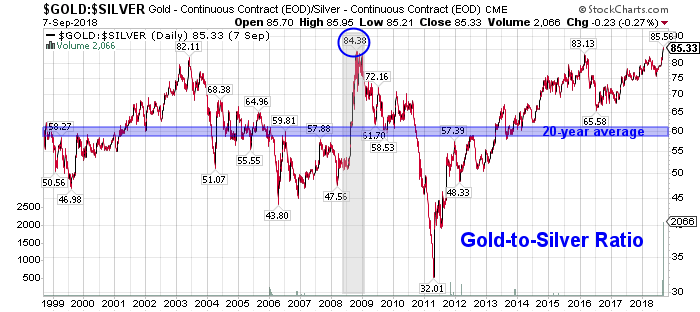
For
those of you who are bullion buyers for your precious metals holdings the
Gold/Silver Ratio inverted at 90 to 1!
Silver in relationship to gold is clearly the better bargain with a
greater potential of going up – or going down less – than gold bullion.
Till
Next Time
DYI
No comments:
Post a Comment