Tuesday, March 31, 2020

Gold
 News

Gold going to $3,000 as U.S. deficit rises sharply as a percentage of GDP 

While many analysts are bullish on gold after the Federal Reserve announced its open-ended quantitative easing program at the start of the week, WingCapital said that it is watching rising U.S. debt compared to GDP. They said this will be a bigger factor on gold compared to the Federal Reserve s unprecedented monetary policy. 
“Historically we notice that the level of deficit relative to GDP exhibits even higher correlation than the size of Fed's balance sheet,” they said. Specifically, we observe that gold's previous secular bull run ended when deficit / GDP started declining and did not bottom until the ratio's trough in 2016.” 
In this environment, the analysts said that gold prices could rise to $3,000 over the next three years.

Opinion: The economic and monetary conditions are perfect for gold

Interest rates at zero, record deficit spending and the Federal Reserve’s quantitative easing with no preset limits is the perfect environment for gold!
Of the industrial precious metals, silver is the most interesting. It is also at a record discount to gold bullion if one looks at the famous gold-silver ratio, which went to 125 at the March extreme, which is an all-time high. That means one ounce of gold could buy you 125 ounces of silver, although we have retreated some on that indicator as silver has rebounded [Currently as of 3/31/20 114 to 1 ratio].
DYI:  I will be updating all of my formulas for the month of April tomorrow.  See you then! 
 DYI

Sunday, March 29, 2020

Bubble
Popping News
DYI:  I don’t see a flat out route for the American dollar but a never ending grinding down such as what happened to the British Pound Sterling.  Their demise started around the turn of the 20th century and was replaced as the world’s currency after the completion of World War II.  Around 45 years in the making before recognized completely that the almighty American dollar as the new reserve currency.  If the SDR’s are put into place and especially used for world wide financing with a functioning bond market then yes this will be the beginning of the end for the dollar as a reserve currency.  With decade after decade of grinding down devaluations until all will be seen as a secondary currency exampled by the Canadian dollar or the British Pound.     
Till Next Time    
DYI

Get Ready for World Money

Since Federal Reserve resources were barely able to prevent complete collapse in 2008, it should be expected that an even larger collapse will overwhelm the Fed’s balance sheet.
The task of re-liquefying the world will fall to the IMF because the IMF will have the only clean balance sheet left among official institutions. 
The IMF will rise to the occasion with a towering issuance of special drawing rights (SDRs), and this monetary operation will effectively end the dollar’s role as the leading reserve currency.
There’s a formula for determining that, and as of today there are five currencies in the formula: dollars, sterling, yen, euros and yuan. Those are the five currencies that comprise in the SDR calculation.
On Jan. 7, 2011, the IMF issued a master plan for replacing the dollar with SDRs. This included the creation of an SDR bond market, SDR dealers, and ancillary facilities such as repos, derivatives, settlement and clearance channels, and the entire apparatus of a liquid bond market. A liquid bond market is critical.
The SDR can be issued in abundance to IMF members and can also be used in the future for a select list of the most important transactions in the world, including balance-of-payments settlements, oil pricing and the financial accounts of the world’s largest corporations, such as Exxon Mobil, Toyota and Royal Dutch Shell.
 You’ll still have dollars, but they’ll be local currency like the Mexican peso, for example. But its global dominance will end. 
Based on past practice, we can expect that the dollar will be devalued by 50–80% in the coming years. 
A devaluation of this magnitude will wipe out the value of your life’s savings. You’ll still have just as many dollars, but they won’t be worth nearly as much. 
Individuals will not be allowed to own SDRs, but you can still protect your wealth by buying gold — if you can find any. 
Regards,
Jim Rickards

Physical silver supply squeeze about to get worse 

warns Keith Neumeyer

The collapse in the U.S. economy and financial markets have brought about a record buy spree in physical silver bullion never witnessed before.  In the past few weeks, precious metals dealers have totally wiped through the available stock.  Now, these dealers have to resort to pre-selling future supply with the understanding that metal purchased today will not be delivered for weeks, a month, or several months.

"It's Selling Like Toilet Paper": If You Haven't Bought Physical Gold Yet, It's Probably Too Late

As gold became increasingly financialized in recent years - through futures, ETFs, derivatives and so on - and as the impact of "financialized" gold became the dominant price-setting factor in a world where the nominal volume of "paper gold" traded is now orders of magnitude greater than "physical", a bizarre decoupling emerges every time there is a major market stress event. 
A pattern that has emerged is that during periods of "bathwater" liquidation, when levered asset managers are forced to dump paper gold to cover margin calls in different parts of their book, sending the price of gold sharply lower also happens to be when physical gold buyers step up amid concerns over the viability of either the financial system and/or the reserve currency.
 One thing the FT [Financial Times] does get right is that "retail investors in Europe and the US have bought up gold and silver bars and coins over the past two weeks in an effort to protect their money from the collapse in global stock prices and many currencies." 
And with the Fed now set to unleash unprecedented dollar destruction by injecting over $625 billion in freshly printed fiat into the system this week alone...
 DYI

Saturday, March 28, 2020

The U.S. now joins large swaths of Europe and Japan that also have negative-yielding debt.


Popping

Bubbles
Yields on both the 1-month and 3-month Treasury bills dipped below zero Wednesday, a week and a half after the Federal Reserve cuts its benchmark rate to near zero and as investors have flocked to the safety of fixed income amid general market turmoil. 
It was the first time that happened in 4½ years, when both bills briefly flashed red and yields fell to minus-0.002% each. The readings Wednesday were well below those. The one-month traded at minus-0.053% while the three-month was at minus-0.033% around 2:35 p.m. ET.
 DYI:  Unfortunately the popping of the junk bond bubble another run to quality [relatively speaking] and safety to short term treasury bills dropping to slightly negative yields.  A typical static 60% stocks, 30% bonds, and 10% bills [cash] portfolio has been hit hard with a peak to current trough 27% decline for equities.  This typical asset allocation would have intermediate term bonds with a mixture of high grade corporate and Treasury notes that has experienced a nice bump up in price however this will decline future compounding [lowering current yield].  Vanguard’s Intermediate-Term Bond Index Fund Admiral Shares (VBILX) is now a scant 1.77% yield.  T-bills are now negative yield much to the chagrin for our typical 60 – 40 – 10 investor.

So…

I’ll do the math just sit back and let’s see would our estimated average annual return will be if we put our money into our 60 – 40 – 10 portfolio today going to sleep like Rip Van Winkle waking 10 years from now.

Stocks…3.13% x .60 = 1.878% rounding 1.9%
Bonds…1.77% x.30 = 0.531% rounding 0.5%
Cash…0% x .10 = 0% rounding 0%

Adding them all up [1.9 + 0.5 + o] = 2.4%

2.4% average annual return for the next ten years.  For a retirement account with that return you will need to buy the recipe book 15 ways to eat Alpo dog food and enjoy it!  Ouch!

Valuations for both stocks and bonds remain absurdly priced.  Our long term investor will have to continue to wait for improved valuations.

Till Next Time
  DYI

Friday, March 27, 2020

Outrage!

A man worth over $100 billion, who makes, on average, $230,000 per minute calling on the public to help his own impoverished employees was not met well by many.

A
mazon CEO Jeff Bezos, the world’s first centibillionaire, a man who vies with Bill Gates for the title of the planet’s richest individual, is asking the public for donations to provide basic support to his 800,000 employees who are suffering in poverty in the wake of the COVID-19 pandemic. Bezos announced:

“We are establishing the Amazon Relief Fund with a $25 million initial contribution focused on supporting our independent delivery service partners and their drivers, Amazon Flex participants, and seasonal employees under financial distress during this challenging time.”
The fund will also support both employees and contractors around the world that face economic hardship due to natural disasters or unforeseen personal circumstances. Those who qualify can apply for a grant of up to $5,000.
A man worth over $100 billion, who makes, on average, $230,000 per minute calling on the public to help his own impoverished employees was not met well by many.
 Amazon itself is worth over $1 trillion, and some felt Bezos himself was in a better position than others, especially members of the public also economically hit by the COVID-19 pandemic, to help his own staff. Furthermore, the company is notorious as a bad employer. Forced to forego bathroom breaks, many company warehouse workers are effectively compelled to wear diapers during their shifts. Other employees report working in unsafe environments and being punished for injuries sustained on the job. The company also does not provide its employees with regular access to clean water.
Amazon workers are poor. Really poor. In Arizona, for example, the company’s own data suggests that one in three employees depend upon food stamps to put food on the table. It is the twenty-eighth largest employer in the state. However, it ranked fifth on the list for most employees enrolled in the Supplemental Nutritional Assistance Program (SNAP). Across the United States, it is a similar story. In Pennsylvania, for instance, Amazon is the nineteenth largest employer but is in fifth place on the SNAP employees list of corporations. And amidst the deadly COVID-19 pandemic HOAX [DYI] sweeping the globe, the job is one of the more dangerous around, as workers are constantly on the move, handling a great number of packages and in close proximity to others. Despite its poor pay, the job is considered essential to the upkeep of society.
CORONA VIRUS FAKE FAKED HOAX STEAL FROM TREASURY GATES VACCINES THEFT LIARS WHO CDC 
Why I Believe the Coronavirus Scare Has Been Manufactured
 by Russell Sackett
My frst clue all of this is a giant scam is the history of all these “pandemics” in recent years. Let’s see, we had H1N1, H5N1, Bird fu, Swine Flu, Zika, Ebola, West Nile, the list goes on. There didn’t seem to be anything that happened as a result of any of these epidemics, at least not from my experience or perspective, or anyone else I’ve spoken to about the subject. Even according to the WHO, most people recover from this virus in two to six weeks without incident. So what’s the big deal? 

With all these cases, the symptoms are always similar to any common cold, potentially freaking out mass amounts of people about simply having a case of the sniffes. This is what they’re after: maximum fear and agitation of the masses. Guess which states are currently reporting the highest number of cases? If you guessed California, Washington and New York, you win the prize! Also High on the list are Texas, Colorado, Illinois, Virginia and Massachusetts. We have seen these states connected to all the recent fakery of the last century via their proximity to Intelligence/ military operations.

 If we crunch numbers, the coronavirus looks very fishy. First off, it's incredibly easy to fake illness and mortality figures. All a federal agency like the CDC needs to do is publish the numbers. 
"There's no way for the average Joe to fact-check them."

 And we already know the CDC lies all day long about things like flu deaths in order to push vaccines and diagnostic products. This Foreign Policy Journal article titled "How the CDC Uses Fear Marketing to Increase Demand for Flu Vaccines" is quite informative on this front.

 It links us to a presentation by the CDC’s director of media relations in 2004, at a workshop for the Institute of Medicine (IOM). Unfortunately the link has since been broken (naturally), but here is what the FPJ article says:

 In its presentation, the CDC outlined a “‘Recipe’ for Fostering Public Interest and High Vaccine Demand”. It called for encouraging medical experts and public health authorities to “state concern and alarm” about “and predict dire outcomes” from the flu season. To inspire the necessary fear, the CDC encouraged describing each season as “very severe”, “more severe than last or past years”, and “deadly”.

DYI:  The last article above is a great starting point to help you in seeing all of these hoaxes our government in line with big business – [and their elite owners] – to steal vast quantities of money from your hard earned tax dollars.  Raiding treasuries is as old as the hill’s that has recently pushed to a fevers pitch!

Have you noticed all of the hoaxed faked – nobody died nor wounded – mass shootings have now stopped?  Are we to suppose to think all of the crises actors playing the mass shooters are home with Corona Hoax cold? 

 Till Next Time
DYI

Thursday, March 26, 2020


Junk Bond
Bubble Bursts!

U.S. Junk Bonds Enter Distress, Spreads Top 1,000 Basis Points


Image result for distressed spreads high yield risk premiums exceeds 1,000 basis points chart pictures

The average spread over Treasuries for bonds in the Bloomberg Barclays U.S. Corporate High-Yield index widened 37 basis points to 1,013 basis points, the highest since June 1, 2009, and a level that is typically associated with distress. The measure has surged from 550 basis points two weeks ago.

The index move caps a tumultuous week for credit markets as investors flee funds that buy all types of corporate debt. A record $35.6 billion was pulled from investment-grade bond funds in the week ended March 18, and $2.9 billion was withdrawn from high-yield funds, according to Refinitiv Lipper.

Still, some analysts are warning the worst is yet to come for the market amid growing fears about the economic fallout from the fast-spreading corona virus hoax. The amount of distressed bonds and loans in the market had swelled to $533 billion as of Thursday, more than doubling from two weeks ago, data compiled by Bloomberg show.

DYI:  Another has fallen from the sky as this time it is high yield paper or more commonly called junk bonds.  5 year T-notes are yielding 0.56% as compared to Vanguard High-Yield Corporate Fund Investor Shares (VWEHX)* yielding 7.68%!  Finally the spread is enough compensation for the risk in high yield paper plus at this yield you will have a good possibility of overcoming the much understated rate of inflation.  Dollar cost averaging only at this point if the spread moves beyond single digits then lump summing would be advocated.

*VWEHX current average effective maturity is 4 years as compared to 5 year T-notes or respectively 7.68% to 0.56%.
Till Next Time

DYI


Tuesday, March 24, 2020

Oil
Smash!
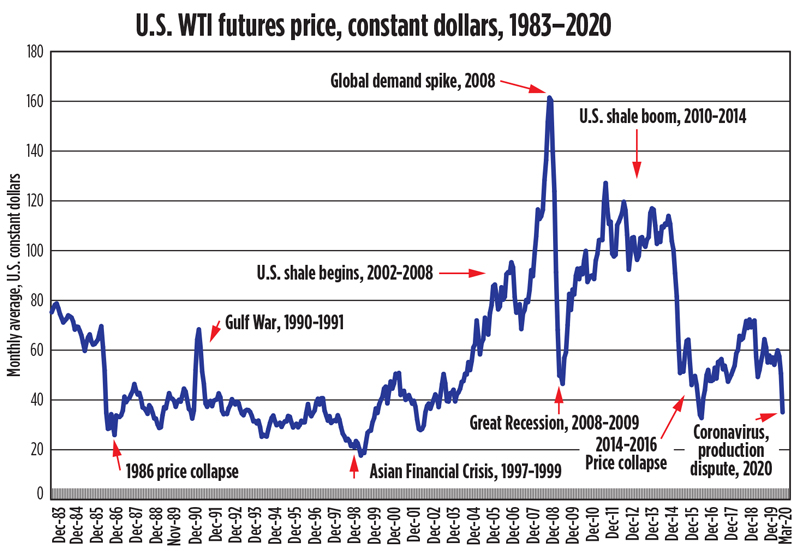
Image result for U.S. WTI futures prices, constant dollars, 1983-2020 chart pictures
As of  3/24/20
$24.42
Accordingly, in constant dollars, many industry veterans might think that the era of lowest oil prices was in the back half of the 1980s, after the early-1986 price collapse. Yet, this has proven not to be true—the period of lowest prices, in constant dollars, was in late 1998 and early 1999, during the Asian Financial Crisis. In fact, the March 18, 2020, level of $20.37 is only exceeded by the December 1998, January 1999 and February 1999 monthly averages of $17.67, $19.45 and $18.69. This can be seen clearly in the accompanying chart, showing the various highs and lows of WTI futures prices over a 37-year period. 
By the same token, there have been four distinct periods of rising or elevated oil prices. These include the Gulf War (1990-1991), when Iraq invaded Kuwait, plus the period when drilling was introduced to various U.S. shale plays (2002-2008), along with the global demand spike of 2008, and the full-out U.S. shale boom of 2010-2014. In constant dollars, monthly average oil prices topped out at above $68 in October 1990; greater than $95 in July 2006; higher than $161 in June 2008; and in excess of $116 in August 2013. These rates stand in stark contrast to the current price level.

Oil Majors Slash Spending Amid Price Plunge

Shell became the latest oil major to announce significant spending cuts to protect its balance sheet from crashing oil prices, joining other majors such as Exxon in the drive to optimize costs at oil below $30 a barrel.   
France’s Total also announced on Monday organic capex cuts of more than US$3 billion, equal to more than 20 percent,  with 2020 net investments now cut to less than US$15 billion.  Total also suspends its buyback program, after it had announced a US$2 billion buyback for 2020 in a $60 a barrel environment.
 DYI:  Oil prices as measured by West Texas Intermediate in the $20 dollar range makes for reasonable prices for the oil/gas & service companies.  In their teens they become a great bargain and if in single digits on the give-away-table.  This is a great time to dollar cost average into your favorite energy fund.  If oil prices fall further increase your amount [if possible] for dollar cost averaging.  Single digits?  Lump sum plus the kitchen sink.  Give-away-table prices come around a few times in an investor’s lifetime, IF this happens load up.
Till Next Time
DYI

Disclaimer

This blog site is not a registered financial advisor, broker or securities dealer and The Dividend Yield Investor is not responsible for what you do with your money.
This site strives for the highest standards of accuracy; however ERRORS AND OMISSIONS ARE ACCEPTED!
The Dividend Yield Investor is a blog site for entertainment and educational purposes ONLY.
The Dividend Yield Investor shall not be held liable for any loss and/or damages from the information herein.
Use this site at your own risk.

PAST PERFORMANCE IS NO GUARANTEE OF FUTURE RESULTS.

Sunday, March 22, 2020

The
Corona Hoax

Public Health Advisor (Quarantine Program)

Job ID HHS-CDC-D3-20-10640010Date posted 11/15/2019Location Dallas, Texas, El Paso, Texas, Houston, Texas, Seattle, Washington, Anchorage, Alaska, Los Angeles, California, San Diego, California, San Francisco, California, Miami, Florida, Atlanta, Georgia, Honolulu, Hawaii, Chicago, Illinois, Boston, Massachusetts, Detroit, Michigan, Minneapolis, Minnesota, Newark, New Jersey, New York, New York, Philadelphia, Pennsylvania, San Juan
Department: Department of Health And Human Services
Agency: Centers for Disease Control and Prevention
Job Announcement Number: HHS-CDC-D3-20-10640010
SALARY RANGE: $51440.0 to $93077.0/Per Year
OPEN PERIOD: 2019-11-15 to 2020-05-15
SERIES & GRADE: GS--9/11

Event 201

The Johns Hopkins Center for Health Security in partnership with the World Economic Forum and the Bill and Melinda Gates Foundation hosted Event 201, a high-level pandemic exercise on October 18, 2019, in New York, NY. The exercise illustrated areas where public/private partnerships will be necessary during the response to a severe pandemic in order to diminish large-scale economic and societal consequences.

CDC Members Own More Than 50 Patents Connected to Vaccinations

The CDC Immunization Safety Office is  responsible for investigating  the safety and effectiveness of all new vaccinations; once an investigation is considered complete, a recommendation is then made to the  CDC’s Advisory Committee on Immunization Practices (ACIP) who then  determines whether the new vaccine will be added to the current  vaccination schedule. Members of the  ACIP  committee include physicians such as Dr. Paul  Offit, who also serves as the  chief of infectious diseases at the Children's Hospital of Philadelphia.  Offit  and other  CDC members  own  numerous patents associated with vaccinations and regularly receive funding for their research work  from the very same  pharmaceutical companies who  manufacturer  vaccinations which are ultimately sold to the public. This situation creates an obvious conflict of interest, as  members of the  ACIP  committee  benefit financially every time a new vaccination is released to  the market.

Members of the  ACIP  Committee  Directly Influence Public Health

Each of the 12  members of the CDC's  ACIP  Committee has a significant influence on the health of nearly every member of the American population. Because they are responsible for adding to  and/or altering the national vaccine schedule, it is of critical importance that they remain objective and unbiased before determining whether a new vaccination is appropriate for use, particularly in the bodies of vulnerable young children. Unfortunately, a significant number of  ACIP  committee members  receive direct financial returns when more vaccinations are added to the current schedule.
 Many own  vaccination related patent(s) and/or stock shares of the pharmaceutical companies  responsible for supplying  new vaccines  to the public. Others receive research grant money, funding for their academic departments, or payments for the oversight of vaccine safety trials.
Maria writing in from the web site Cutting Through the Fog.
As expected!
Is anyone working on a paper on the Corona scam? I saw these photos that allegedly are of intensive care unit Corona patients in a hospital in Cremona, Italy:
and
https://www.thesun.co.uk/news/11131963/coronavirus-life-support-italy-photos/
Some of the patients are lying face down, which I find strange given they are supposed to have airway problems and may need assistance to breathe. I also wonder why they are mostly naked and why they have bandages around their heads. One of them also have bandages around his feet.

How the CDC Uses Fear Marketing to Increase Demand for Flu Vaccines

The CDC’s questionable estimates of annual flu hospitalizations and deaths align with its fear marketing strategy to increase demand for flu vaccines.

T
he US Centers for Disease Control and Prevention (CDC) claims that its recommendation that everyone aged six months and up should get an annual flu shot is firmly grounded in science. The mainstream media reinforce this characterization by misinforming the public about what the science says.

New York Times article from earlier this year, for example, in order to persuade readers to follow the CDC’s recommendation, cited literature reviews of the prestigious Cochrane Collaboration to support its characterization of the influenza vaccine as both effective and safe. The Times said the science showed that the vaccine represented “a big payoff in public health” and that harms from the vaccine were “almost nonexistent”.
What the Cochrane researchers actually concluded, however, was that their findings “seem to discourage the utilization of vaccination against influenza in healthy adults as a routine public health measure” (emphasis added). Furthermore, given the known serious harms associated with specific flu vaccines and the CDC’s recommendation that infants as young as six months get a flu shot despite an alarming lack of safety studies for children under two, “large-scale studies assessing important outcomes, and directly comparing vaccine types are urgently required.” The CDC also recommends the vaccine for pregnant women despite the total absence of randomized controlled trials assessing the safety of this practice for both expectant mother and unborn child. (This is all the more concerning given that multi-dose vials of the inactivated influenza vaccine contain contain the preservative Thimerosal, which is half ethylmercury by weight. Ethylmercury is a known neurotoxin that can cross the blood-brain barrier and accumulate in the brain. It can also cross the placental barrier and enter the brain of the developing fetus.)
The Cochrane researchers also found “no evidence” to support the CDC’s assumptions that the vaccine reduces transmission of the virus or the risk of potentially deadly complications—the two primary justifications claimed by the CDC to support its recommendation.
It is clear that the CDC does not see its mission as being to educate the public in order to be able to make an informed choice about vaccination. After all, that would be incompatible with its view that growing health literacy is a threat to its mission and an obstacle to be overcome
On the other hand, a misinformed populace aligns perfectly with the CDC’s stated goal of using fear marketing to generate more demand for the pharmaceutical industry’s influenza vaccine products.
DYI:  The article above is lengthy but if there ever was a time for the long version it is now.  Well worth the effort!

A statistical analysis of China’s coronavirus casualty data shows a near-perfect prediction model that data analysts say isn’t likely to naturally occur, casting doubt over the reliability of the numbers being reported to the World Health Organization. That’s aside from news on Thursday that health officials in the epicenter of the outbreak reported a surge in new infections after changing how they diagnose the illness.

In terms of the virus data, the number of cumulative deaths reported is described by a simple mathematical formula to a very high accuracy, according to a quantitative-finance specialist who ran a regression of the data for Barron’s. A near-perfect 99.99% of variance is explained by the equation, this person said.
Put in an investing context, that variance, or so-called r-squared value, would mean that an investor could predict tomorrow’s stock price with almost perfect accuracy. In this case, the high r-squared means there is essentially zero unexpected variability in reported cases day after day.
Real human data are never perfectly predictive when it comes to something like an epidemic, Goodman says, since there are countless ways that a person could come into contact with the virus.
For context, Goodman says a “really good” r-squared, in terms of public health data, would be a 0.7. “Anything like 0.99,” she said, “would make me think that someone is simulating data. It would mean you already know what is going to happen.”
Guest Writer takes on the Corona Hoax
DYI

Saturday, March 21, 2020


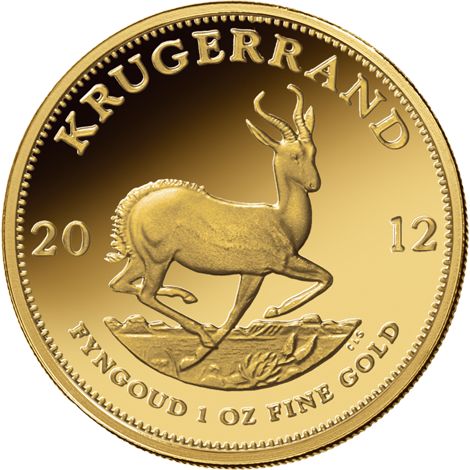
Image result for kugerand gold coins pictures

Gold is setting records dating back over 5,000 years — against silver

Image result for gold silver ratio bdswiss pictures

As of 3/20/20
119 to 1
“Lower expected inflation would mean a) central banks cut their policy rates, and lower interest rates tend to boost the gold price, and b) lower expected inflation probably stems from lower expected economic activity, which might imply less industrial demand for silver – although I must admit I couldn’t find a clear link between industrial activity and the price of silver,” he writes. 
Aakash Doshi, an analyst at Citi, also pointed to that connection with expected inflation. 
“Even as the excessive collapse in inflation breakevens may be viewed as a headwind for gold upside, the yellow metal should outperform silver in a deflation and growth shock scenario,” he said.
DYI:  If you are precious metals buyer what we do know with such a lopsided gold to silver ratio is this:  overtime silver will increase in price with greater percentage gains than gold in a bullish market and conversely in a down market silver will lose far less than gold.  That is what we know.
 
So…If you already have gold now is the time to sell and purchase silver for both enhanced upside potential and downside protection.  That is what is needed to do for investors who hold precious metals 100% of the time.  However if you work with the four primary asset categories; stocks, long term bonds, precious metals and cash it is necessary to see how the metals stack up against financial assets and in particularly stocks.
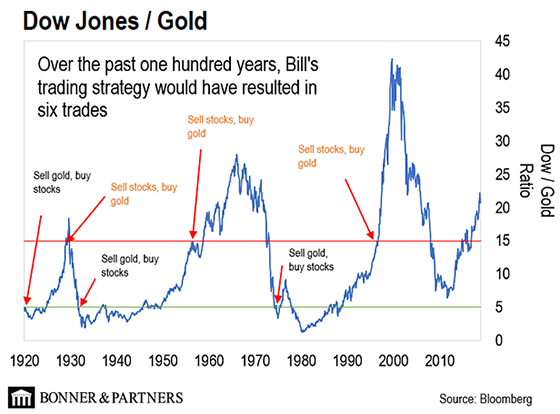
Image result for dow/gold ratio chart pictures
As of 3/20/20
13.50
The Dow to Gold Ratio is at a lower 13.50 to 1 stocks are no longer insanely priced however valuation remains very pricey!  Until stocks break below 10 they will then become reasonably priced; and below 5 placing equities on the give-away-table.
  
Oil per Barrel Drops below $20!


I have pointed out the oil/gas/service sector as a buy with great dividend yields at 4 1/2 % plus while waiting for a potential capital gain [see disclaimer at bottom of post]. Our favorite as you might have guessed is Vanguards Energy Fund Investor Shares (VGENX) is now cheap not on the give-away-table but is a bargain.  You may have your favorite as well.

Till Next time

Disclaimer

This blog site is not a registered financial advisor, broker or securities dealer and The Dividend Yield Investor is not responsible for what you do with your money.
This site strives for the highest standards of accuracy; however ERRORS AND OMISSIONS ARE ACCEPTED!
The Dividend Yield Investor is a blog site for entertainment and educational purposes ONLY.
The Dividend Yield Investor shall not be held liable for any loss and/or damages from the information herein.
Use this site at your own risk.

PAST PERFORMANCE IS NO GUARANTEE OF FUTURE RESULTS.
DYI