
3-1-20
Updated Monthly
Updated Monthly
Secular Market Top - Since January 2000
+121.0% Dow
+215.3% Transports
+196.4% Utilities
+101.1% S&P 500
+110.5% Nasdaq
+74.2% 30yr Treasury Bond
+441.0% Gold
+63.3% Swiss Franc's
From High to Low - Since Year 2000
+441.0% Gold
+215.3% Transports
+196.4% Utilities
+121.0% Dow
+110.5% Nasdaq
+101.1% S&P 500
+ 74.8% Oil
+110.5% Nasdaq
+101.1% S&P 500
+ 74.8% Oil
+ 74.2% 30yr Treasury Bonds
+ 63.3% Swiss Franc's
December 1999 Shiller PE10 was 44.19
August 2000 S&P 500 dividend yield was 1.11%
Shiller PE10 3-2-20 is 29.34
S&P 500 dividend yield 3-2-20 is 1.88%
[Shiller PE10 & dividend yield is reported using data from the beginning of the month when I update. It may or may not exactly be the first trading day of the month.]
DYI: Gold since the year
2000 has blown past stocks or bonds on a NON total return basis hands down. The nearest competitor the Dow Jones
Transports at 215.3% as compared to gold at 441.0% or 105% greater! Comparing the S&P 500 – AFTER inflation
[CPI] – on a total return basis (dividends reinvested) since the year 2000 is a
scant 179%.
DYI is not a gold or
silver bug site; the year 2000 the Shiller PE was trading at an astronomical
44 times earnings! Precious metals and
their mining companies were on the give-away-table from 1998 to
the year 2002. This allowed an investor
5 full years to systematically sell off stocks and load up precious metals and
their mining companies.
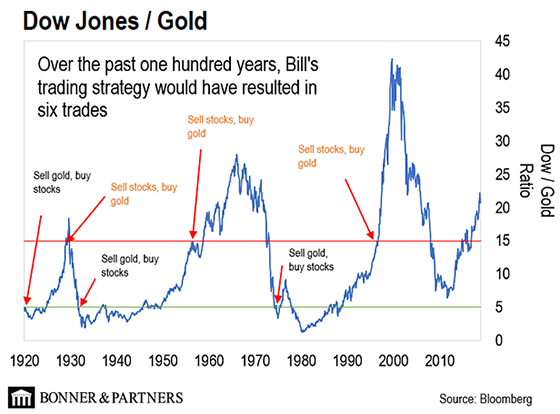
How did I know it was
time to sell off stocks in mass and buy precious metals? The Dow/Gold Ratio was screaming
massive over valuation for stocks and incredibly low valuation for precious
metals. Simple!
As of 3/3/20
Dow/Gold Ratio
17 to 1
(rounded)
DYI
No comments:
Post a Comment