Oil
Smash!
As of 3/24/20
$24.42
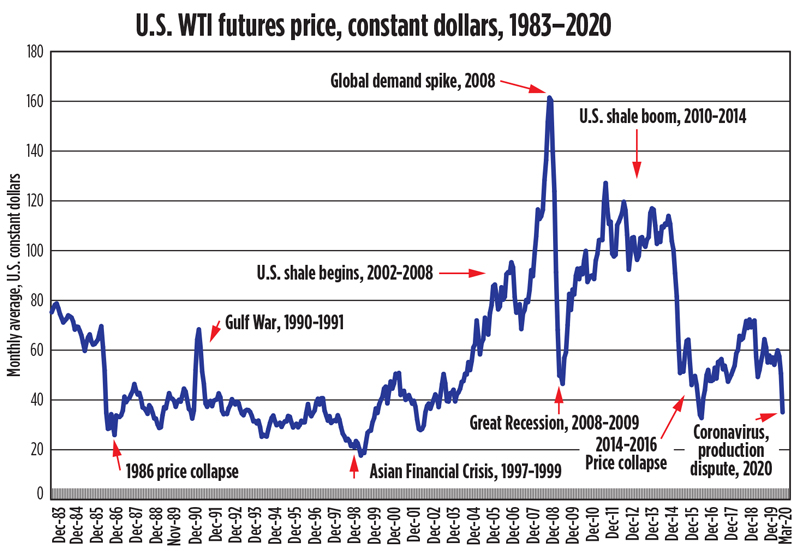
Accordingly, in constant dollars, many industry veterans might think that the era of lowest oil prices was in the back half of the 1980s, after the early-1986 price collapse. Yet, this has proven not to be true—the period of lowest prices, in constant dollars, was in late 1998 and early 1999, during the Asian Financial Crisis. In fact, the March 18, 2020, level of $20.37 is only exceeded by the December 1998, January 1999 and February 1999 monthly averages of $17.67, $19.45 and $18.69. This can be seen clearly in the accompanying chart, showing the various highs and lows of WTI futures prices over a 37-year period.
By the same token, there have been four distinct periods of rising or elevated oil prices. These include the Gulf War (1990-1991), when Iraq invaded Kuwait, plus the period when drilling was introduced to various U.S. shale plays (2002-2008), along with the global demand spike of 2008, and the full-out U.S. shale boom of 2010-2014. In constant dollars, monthly average oil prices topped out at above $68 in October 1990; greater than $95 in July 2006; higher than $161 in June 2008; and in excess of $116 in August 2013. These rates stand in stark contrast to the current price level.
Oil Majors Slash Spending Amid Price Plunge
Shell became the latest oil major to announce significant spending cuts to protect its balance sheet from crashing oil prices, joining other majors such as Exxon in the drive to optimize costs at oil below $30 a barrel.
France’s Total also announced on Monday organic capex cuts of more than US$3 billion, equal to more than 20 percent, with 2020 net investments now cut to less than US$15 billion. Total also suspends its buyback program, after it had announced a US$2 billion buyback for 2020 in a $60 a barrel environment.
DYI: Oil prices as measured by West Texas Intermediate in the $20 dollar range makes for reasonable prices for the oil/gas & service
companies. In their teens they become a
great bargain and if in single digits on the give-away-table. This is a great time to dollar cost average
into your favorite energy fund. If oil
prices fall further increase your amount [if possible] for dollar cost
averaging. Single digits? Lump sum plus the kitchen sink. Give-away-table prices come around a few
times in an investor’s lifetime, IF
this happens load up.
Till Next Time
DYI
Disclaimer
This blog site is not a registered financial advisor, broker or securities dealer and The Dividend Yield Investor is not responsible for what you do with your money.This site strives for the highest standards of accuracy; however ERRORS AND OMISSIONS ARE ACCEPTED!The Dividend Yield Investor is a blog site for entertainment and educational purposes ONLY.The Dividend Yield Investor shall not be held liable for any loss and/or damages from the information herein.Use this site at your own risk.PAST PERFORMANCE IS NO GUARANTEE OF FUTURE RESULTS.
No comments:
Post a Comment