Popping
Bubbles!
In an announcement Friday, the central bank said it was accelerating to Friday purchases it announced a day before. The move comes in response to market demand that the Fed act immediately to quell what has been an extraordinarily volatile time in the bond market, with yields sinking to historic lows amid rising liquidity concerns.
As Everything Bubble Implodes, Frazzled Fed Rolls Out Fastest Mega-Money Printer Ever, up to $4.5 Trillion in Four Weeks
Last week, the 10-year Treasury yield had plunged toward zero during the stock market sell-off, which was crazy but in line with the logic that investors were all piling into safe assets, and early Monday morning it fell to an unthinkable all-time low of 0.38%.
But then, the 10-year yield more than doubled from 0.38% at the low on Monday to 0.88% at the highpoint on Thursday. That the 10-year yield spikes during a stock market crash is somewhat of a scary thought. It means that both stocks and long-dated Treasury securities are selling off at the same time. And that probably made the Fed very nervous.
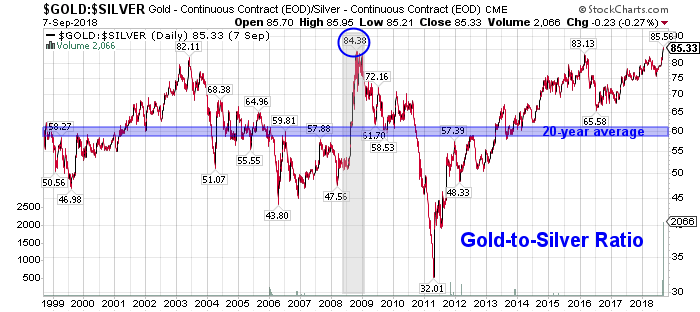
Demand for physical silver is surging and the U.S. Mint can't keep up
Some analysts have noted that silver is becoming more attractive to investors as its significantly undervalued compared to gold. Thursday, the gold/silver ratio hit its highest level in history at 101 [DYI blasted to 116!], meaning it takes more than 100 ounces of silver to equal one ounce in gold.
Analysts have noted that the ratio has only hit 100 a few times in history and prices are due to fall back to historical average ratio around 50 or 60 points.
%
DYI
Gold/Silver
Allocation
3-1-20
Updated Monthly
100 – [100 x (Current GS – Avg. GS / 4)
_______________________________________
(Avg.GS x 2 – Avg. GS / 2)
[The formula's answer allocates gold percentage]
[The formula's answer allocates gold percentage]
Current Gold/Silver Ratio 95
Average Gold/silver Ratio 50
Allocation:
Gold 0%
Silver 100%
Average Gold/Silver Ratio since 1900
50 to 1
Current Ratio as of 3/16/20
116 to 1
DYI: The Federal Reserve – with zero reserves nor is it Federal but privately
owned will resume the only two things they know to do during a downturn;
electronically print money to drive down yields for Treasury securities. This time they are going to move far more
aggressively at the long end of the interest rate curve. That is to say 10, 20 and all the way out to
30 year T-bonds yields will be pounded down way below the real rate of
inflation in a vain attempt to increase loan activity hence increase economic
activity.
For those of you who own long term treasuries capital gains is a highly
likely event to occur. Silver in relation to
gold is on the give-away-table. This is
telling us in an up market for precious metals over time silver will out pace
the percentage gains for gold and conversely in a down market for precious
metals silver’s decline will be far less severe than gold.
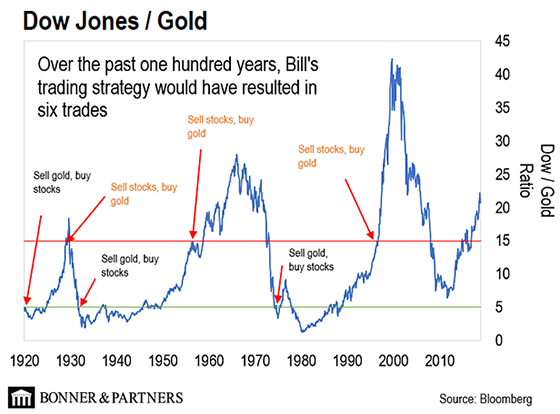
The Dow/Gold Ratio currently at 17 to 1
remains bullish for the metals as this stock market remains insanely priced!
TILL NEXT TIME
DYI
No comments:
Post a Comment