December 7, 2015
John P. Hussman, Ph.D.
On the basis of valuation measures most closely correlated with actual subsequent 10-12 year S&P 500 total returns in market cycles over more than a century, a ranking of the most overvalued extremes in U.S. history, in order of severity, includes:
2000, 2015, 1929, 2007, 1937, 1907, 1968, and 1972.
While the 1969-70 retreat took the S&P 500 down by only one-third of its value, each of the other instances was followed by market losses of 50% or more over the completion of their respective market cycles. Given that 2015 is the second highest valuation extreme on record, such an outcome is not some worst-case scenario, but is instead a rather run-of-the-mill expectation.
Notably, the 2000 market peak was dominated by large-capitalization stocks and the technology sector. The recent Fed-induced speculative bubble actually brought the valuation of the median stock beyond the 2000 extreme, marking the most offensive point of overvaluation in history for the broad market.
A 50% market loss would not even bring the most historically reliable valuation measures materially below their long-term averages.DYI Comments: Today as measured by the average dividend yield going all the way back to 1871 is 4.40%. Converting to (PD) price to dividends [ 1 / 4.40 = 23 (rounded) ] is 23 to 1.
Currently today the markets price to dividend ratio is 49 to 1 (or 2.03%). Applying simple arithmetic the market as measured by dividends is trading 113% above its historical average [ ( 49 - 23 ) /23 x 100 = 113% ]. This is from average PD to where we are now! Bargains are when asset prices are trading below their historical norms. The U.S. stock market is clearly massively overvalued. Expectations from these extreme levels of a 50% decline (DYI is 45% to 60%) would be as John Hussman states: RUN OF THE MILL MARKET DECLINE!
DYI's weighted averaging formula that increases your allocation proportionally greater when values are below their average and decreases you proportionally greater when values are above the average. It is as simple as that. Currently today valuations are so high our formula has "kick us out" (for good reason) of the stock market. DYI are NOT market timers; DYI weighs the market. Slowly increasing or decreasing your percentage allocation as determined by the degree of over or under their valuation average. These changes take years to complete a market cycle from peak to peak or trough to trough. DYI includes three other assets gold (precious metals mining companies), long term high quality bonds (gov't & corporate) and short term bonds (cash). All four are highly correlated to the economy and greater than 3 to 5 year periods of time UNCORRELATED to each other.
THERE'S A BULL MARKET SOMEWHERE
Within a 3 to 5 year time period one(sometimes two) of the three assets, stocks, Lt. bonds or gold will be in a bull market. Cash or short term bonds is simply are holding area until valuations of the other three become worthy with greater valuations.
Currently today gold mining companies share prices have been decimated! The mining industry is not going to disappear. They will close marginal mines, buyouts & mergers, consolidating the industry back into profitability. Over the short to intermediate term (2 to 5 years) share prices will be hammered. This sets up an excellent time to dollar cost average into your favorite precious metals & mining fund at very low prices.

Above is Vanguard's Precious Metals & Mining Fund symbol VGPMX has been decimated with the makings of a bargain. The macro basis our proxy for determining percentage asset allocation is the DOW/GOLD RATIO which has regressed back to its mean.

Neither expensive nor an outright bargain hence our 22% level for our allocation model.
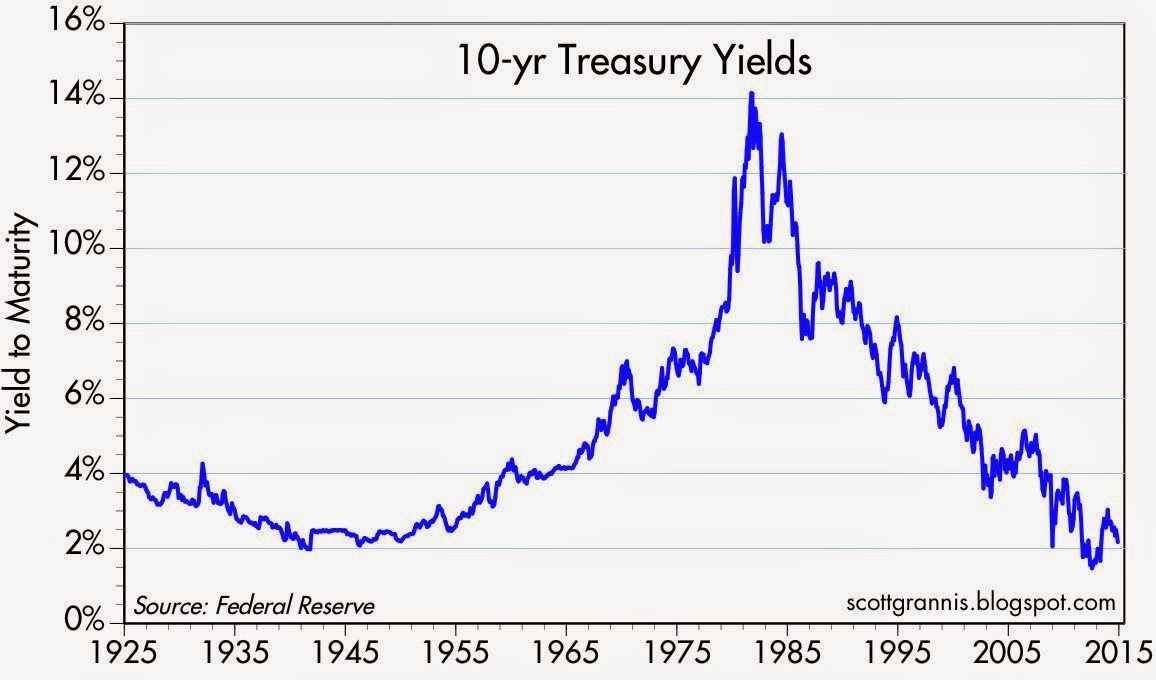
Long term bonds as measured by our proxy the ten year Treasury bond our formula has "kick us out" of that market as well and rightfully. Unless an individual has been living in a cave everyone who is a saver in some form or fashion has been infuriated with these sub atomic low interest rates. They are so low (DYI's opinion) no longer merit investment consideration due to their excessively long duration.
So here we sit with our cash horde and only until recently have put a little extra to use in the gold column (VGPMX). The Great Wait Continues....Just as you think nothing is going to change the economy/valuations will change surprising everyone except the value players here at DYI.
Updated Monthly
No comments:
Post a Comment