Market
Levitation
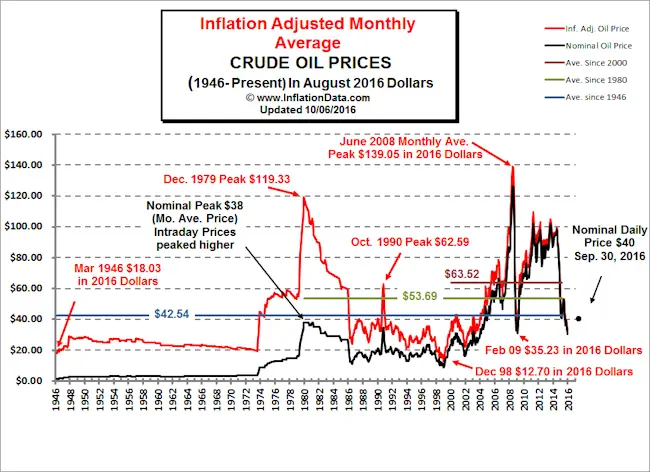
Cheap Oil Prices
The Looming Energy Shock
The next oil crisis will arrive in 3 years or less
There will be an extremely painful oil supply shortfall sometime between 2018 and 2020. It will be highly disruptive to our over-leveraged global financial system, given how saddled it is with record debts and unfunded IOUs.
Due to a massive reduction in capital spending in the global oil business over 2014-2016 and continuing into 2017, the world will soon find less oil coming out of the ground beginning somewhere between 2018-2020.
Because oil is the lifeblood of today's economy, if there’s less oil to go around, price shocks are inevitable. It's very likely we'll see prices climb back over $100 per barrel. Possibly well over.
Pick Your Poison
This is why our view is that either
- the world economy outgrows available oil somewhere in the 2018 – 2020 time frame, or
- the world economy collapses first, thus pushing off an oil price shock by a few years (or longer, given the severity of the collapse)
If (1) happens, the resulting oil price spike will kneecap a world economy already weighted down by the highest levels of debt ever recorded, currently totaling some 327% of GDP:

Remember, in 2008, oil spiked to $147 a barrel. The rest is history -- a massive credit crisis ensued. While there was a mountain of dodgy debt centered around subprime loans in the US, what brought Greece to its knees wasn’t US housing debt, but its own unsustainable pile of debt coupled to a 100% dependence on imported oil -- which, figuratively and literally, broke the bank.
If (2) happens, then the price of oil declines, if not collapses. Demand withers away, the oil business cuts back on its exploration/extraction investments even further, so that much later, when the global economy is trying to recover, it then runs into an even more severe supply shortfall. It becomes extremely hard to get sustained GDP growth back online.
More economic growth requires more energy. Always has and it always will. Oil is the most important form of energy of them all. But everyone assumes -- especially today when it appears as if we're "awash" in it given the current supply glut -- that we will always have access to as much as we need.
7/1/17
Updated Monthly
Oil Prices: 07/01/12....$99.25
07/01/17....$50.26
Down 49%(rounded)
(oil prices approximately one year earlier due to weekends & holidays)
ANS West Coast prices
Down 49%(rounded)
(oil prices approximately one year earlier due to weekends & holidays)
ANS West Coast prices
OIL INDICATOR: Positive Oil indicator will remain positive until it's rise is greater than 75% from five years earlier.
Oil prices are well known for their volatility in the short term, longer term due to dwindling reserves energy prices are in a secular bull market. Technologies such as fracking will extend the life of oil fields but major new discoveries arrive at a snails pace far slower than the world's growth.
As long as prices rise in a slow and orderly pace our economy can adjust to those changes, however if prices spike (international tensions, war etc.) high energy costs behave as a massive deflationary tax. This will send our economy tumbling down and very possibly the U.S. stock market.
If oil prices rise greater than 75% from five years earlier, investors at that time should shift their portfolio geared towards deflationary times. This would be an oil indicator as negative.
If oil prices rise from five years earlier less than 10% or drop then the inflationary play is in effect; a positive for economic growth along with possible higher stock prices.
Where to find five year earlier oil prices? Alaska Department of Revenue
Oil indicator positive
20% REIT's
20% Energy
20% P.M.'s
40% Small Caps
0% Lt. Gov't Bonds
Oil indicator negative
5% REIT's
10% Energy
10% P.M's
10% Small Caps
65% Lt. Gov't Bonds
Vanguard Funds
REIT's
REIT Index Admiral VGSLX
Energy
Energy Fund VGENX
Precious Metals (P.M.'s)
Precious Metals and Mining Fund VGPMX
Small Caps
Small Cap Value Index Admiral VSIAX
Long Term Government Bonds
Long-Term Government Bond Index Admiral VLGSX
Disclaimer
This blog site is not a registered financial advisor, broker or securities dealer and The Dividend Yield Investor is not responsible for what you do with your money.
This site strives for the highest standards of accuracy; however ERRORS AND OMISSIONS ARE ACCEPTED!
The Dividend Yield Investor is a blog site for entertainment and educational purposes ONLY.
The Dividend Yield Investor shall not be held liable for any loss and/or damages from the information herein.
Use this site at your own risk.
PAST PERFORMANCE IS NO GUARANTEE OF FUTURE RESULTS.
No comments:
Post a Comment