Overvalued
Markets
Gary Shilling is out with his latest views, in which he discusses the changeover in the leadership of the US Fed from Janet Yellen to Jerome Powell. Also includes thoughts on why the Fed raised interest rates and how it may affect the markets. Read the column below.
With the pickup in global economic growth, central banks -- except for Japan’s -- are shifting to tightening from extremely easy money, including massive quantitative easing and trivial, if not negative, short-term interest rates. The Federal Reserve has raised its target for the federal funds rate five times since December 2015 and is suggesting three more increases this year.
But the Fed is confronted with a serious dilemma: Inflation and wage increases continue to undershoot its expectations at the same time the central bank confronts forces pressuring it toward credit tightening.
The new chairman, Jerome Powell, who isn’t a trained economist, may change the central bank’s tone, but his soon-to-be predecessor Janet Yellen and the other academic economists who have dominated monetary policy, believe fervently in the theoretical Phillips Curve. It posits that a declining unemployment rate should spur inflation, despite evidence to the contrary. Rather than increase as the unemployment rate declined since the recession, the rate of inflation has largely stayed the same.
Nevertheless, the Fed wants to tighten credit slowly due to chronic low inflation and memories of the May 2013 “taper tantrum,” when a mere mention by then-Chairman Ben Bernanke of reducing the Fed’s rate of asset purchases sent financial markets into tailspins as interest rates leaped.
Another reason for the Fed to tighten is to keep commercial banks from lending out the more than $2 trillion in excess reserves the Fed has given them through quantitative easing. These are simply an asset of the banks and a liability on the Fed balance sheet with little financial or economic consequences. But as economic growth picks up as a result of the tax cuts followed by likely massive fiscal stimulus, creditworthy borrowers will want to borrow, banks will be happy to lend and these excess reserves could turn into tons of money that would threaten major inflation.
The Fed is also concerned about market distortions caused by low rates. The problem isn’t low rates, per se, but investors' unwillingness to accept them despite the offsetting effects of low inflation. Adjusted for inflation, the 30-year Treasury bond yields 0.62 percent, lower than the 1.7 percent average of the last decade but not hugely so. Nevertheless, many investors and savers believe they deserve much higher returns than the 2.97 percent current yield on the 30-year Treasury and 2.73 percent on the 10-year note. So they’ve moved further out on the risk spectrum into assets such as emerging-market bonds, student debts despite high delinquency rates and leveraged loans, to name but a few.
Fed officials, while they believe that in a normal, stable economy, the fed funds rate should be around 3 percent compared to the present 1.25 percent to 1.5 percent range, are also gradually adjusting to reality. They’re suggesting that it may be appropriate for rates to be lower for longer.
I remain convinced that a key reason the Fed has raised rates is because its credibility was at stake, and remains so. It has repeatedly forecast higher fed funds rates than it subsequently initiated. Bear in mind that the Fed controls that rate so it simply didn’t do what it intended. The gap between its fed funds forecasts and actions are extraordinarily wide, ranging to more than four percentage points.
Despite Powell's suggestion that the economy has not run out of slack, the majority of policy makers may worry that the tax cuts could prove stimulative enough to cause major economic strains. In addition, Republican plans for major infrastructure outlays will no doubt concern the Fed about an overheated economy. And that’s despite the likelihood that the actual spending won’t take place for several years.
Historically, once the Fed starts to raise rates it almost always continues until it precipitates a recession and a bear market in stocks. By my count, in 11 of 12 times since World War II, a recession followed a rate-raising campaign, though it can often take years for that to happen. The only soft landing was in the mid-1990s. This time, with so much excess liquidity around the world, it may also take years before higher rates and a reduction in the Fed’s balance sheet assets start to pinch the economy.
The yield curve -- the spread between short- and long-term Treasury rates -- may also behave differently this time. In the past, when the Fed jacked up rates to the point that yields on 2-year Treasuries exceeded those on 10-year notes, the yield curve “inverted” and a recession followed. Inversions typically occurred because 2-year yields rose faster than 10-year yields. Recently, however, the spread has narrowed because 2-year yields have risen but 10-year yields have been relatively stable.
That’s unusual but probably reflects deflationary pressures that are more evident in longer maturities.
So, if an inverted yield curve occurs, it may not, as in the past, guarantee a nearby recession, and it may take years before Fed tightening precipitates one.
DYI: The
one thing that I always want to make crystal clear DYI is not a fast buck in and out market timer
blog. DYI’s active asset allocation is
determined by valuation not whether an economist – and yes Gary Shilling is top
notch – states that the economy may continue its growth [hence stocks continue
their bull run]. Valuations are now so
lofty just one small policy mistake and once the selling begins the rout will take
on a life of its own. Bottom line: at
these levels the risk maybe justified for a dance on the head of a pin speculator
who monitors the markets everyday but for us mere mortals who have other
interest than chronic market watching; valuations for an investor are neither
justified nor sane.

Shiller PE10 as of 3-09-18 is 33.71
Below is a chart from Advisor Perspectives
[dshort.com] highlighting past average annual 10 year real returns.
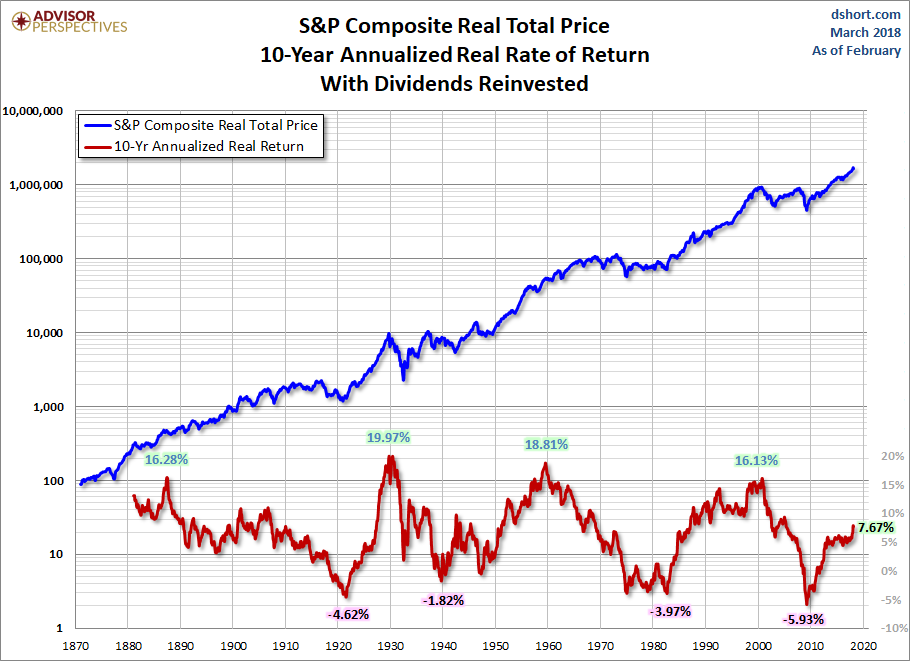
Notice the bottom return numbers for the past
10 year marks. Depressing isn’t it! Remember this is going back from that time
period. Eyeing balling the 2010 mark
computes an average return of -5.93% for stocks held or bought 10 years earlier
at the top of the market year 2000! In
other words purchase or hold stocks year 2000 go to sleep like Rip Van Winkle awaken
10 years later; look at your statement and bang you lost around 1/3 of your
purchasing power! Ouch! But our modern
portfolio advocates tell us it is time in the market not timing the
market. OK…Let’s take a look at 20
years.

Our latest 20 year return has improved to a
real return of 4.57% average annual return.
At the fear of being repetitive purchasing stocks or holding 20 years go to sleep like Rip Van Winkle awaking [20 years hence] and you’re
statement equates to positive 4.57%. But
alas not all 20 year low periods highlighted on this chart are not the same. Notice the rest are nothing more than sub
atomic low returns you would have bested stocks by holding T-Bills!
Let’s give our modern portfolio theory crowd their full ado by going out
30 years [chart below]. Notice returns
will oscillate from 2% to a respectable 11%.
What do these 3 charts illustrate?
Valuations matter and they matter a great deal to your financial health.

“But…But…But I’m dollar cost averaging
[generally 2x per month 401k] not making lump sums 10, 20, or 30 years earlier. Won’t that improve my returns? Maybe yes and maybe no; returns will either
improve or deteriorate depending upon how many of those 2x monthly sum lump
sums we’re at the upper market valuations or below. And yes this is measurable as Warren Buffet’s
teacher Benjamin Graham and author of The Intelligent Investor so aptly teaches
us!
Margin of Safety!
Central Concept of Investment for the purchase of Common Stocks.
"The danger to investors lies in concentrating their purchases in the upper levels of the market..."
Stocks compared to bonds:
Earnings Yield Coverage Ratio - [EYC Ratio]
EYC Ratio = 1/PE10 x 100 x 1.1 / Bond Rate
1.75 plus: Safe for lump sums & DCA
1.30 plus: Safe for DCA
1.29 or less: Mid-Point - Hold stocks and purchase bonds.
1.00 or less: Sell stocks - Purchase bonds.
Current EYC Ratio: 0.84 (rounded)
As of 3-12-18
Updated Monthly
Updated Monthly
PE10 as report by Multpl.com
Bond Rate is the rate as reported by
Vanguard Long-Term Investment-Grade Fund Investor Shares (VWESX)
DCA is Dollar Cost Averaging.
Lump Sum any amount greater than yearly salary.
PE10 ..........33.71
Bond Rate...3.89%
Lump Sum any amount greater than yearly salary.
PE10 ..........33.71
Bond Rate...3.89%
Over a ten-year period the typical excess of stock earnings power over bond interest may aggregate 4/3 of the price paid. This figure is sufficient to provide a very real margin of safety--which, under favorable conditions, will prevent or minimize a loss......If the purchases are made at the average level of the market over a span of years, the prices paid should carry with them assurance of an adequate margin of safety. The danger to investors lies in concentrating their purchases in the upper levels of the market.....
Simple 7th or 8th grade
arithmetic that can be figured using a basic calculator purchased from any
grocery store; simply plug in the numbers from left to right and bingo you have
the answer. Today stocks have left the
planet earth on a valuation basis; so much so over the next 10 years those
dollars invested will be at a loss. It
is possible negative returns will occur at the 20 year mark as well. If it doesn’t then those returns will be sub
atomic low reducing a dollar cost averager’s returns significantly.
Will the U.S. stock market continue on its
merry way as Gary Shilling alluded to? I
have no idea – and here is a not so big secret – nor does anybody else. What we do know stocks based on valuations
are so absurd losses over the next 10 years are damn near guaranteed. Even the next 20 years [remember those
dollars placed today] returns will be dismal at best.
DYI
This blog site is not a registered financial advisor, broker or securities dealer and The Dividend Yield Investor is not responsible for what you do with your money.
This site strives for the highest standards of accuracy; however ERRORS AND OMISSIONS ARE ACCEPTED!
The Dividend Yield Investor is a blog site for entertainment and educational purposes ONLY.
The Dividend Yield Investor shall not be held liable for any loss and/or damages from the information herein.
Use this site at your own risk.
PAST PERFORMANCE IS NO GUARANTEE OF FUTURE RESULTS.
No comments:
Post a Comment