As of 7/22/19 Gold Silver Ratio
87 to 1
Silver Rallies to Its Highest in Over a Year, Plays ‘Catch Up’ to Gold’s Gains
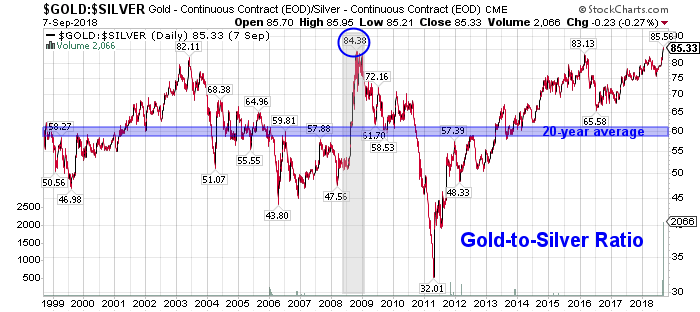
Silver’s rise is likely more related to speculators moving in on what seemed to be cheap prices relative value to gold. We look at relative value by examining the ratio of gold prices to silver prices historically. The Gold Silver ratio had recently reached lofty heights near 100. That is to say you could buy 100 ounces of silver for the price of 1 ounce of gold.
Looking back historically this ratio would have been in the 16 – 25:1 range. Since the 1970’s a range of 40-80:1 was the norm. Every time this ratio hit these highs it retraced as silver prices caught up with gold. Where gold led silver followed, rising twice as fast and sometimes falling even harder. Now we see history repeating itself yet again.
Back of an envelope calculations: We see silver possibly hitting highs of $30 within 18 months if the following were to happen:
1) Brexit fears manifest in a UK & EU recession: chances 75%
2) Worried about stalling global growth, Central Banks unleash coordinated QE 4 and continue printing of money, driving rates even more negative globally: chances 75%
3) Gold starts attracting speculative money pushing safe have bids up even higher to possibly circa $2,500: chances 70%
4) The gold silver ratio reverts back to its 200 day moving average of 86:1. Taking silver to $30.
DYI
No comments:
Post a Comment