Gold’s
Message
U.S. Stock Market Hits a New Record High, but What’s Really Going On?
As Americans head off to Independence Day celebrations, they’ll be greeted with a plethora of headlines about record highs in the U.S. stock market. What I find most interesting about the latest bout of exuberance is the fact that priced in gold, stocks remain far below last fall’s peak.
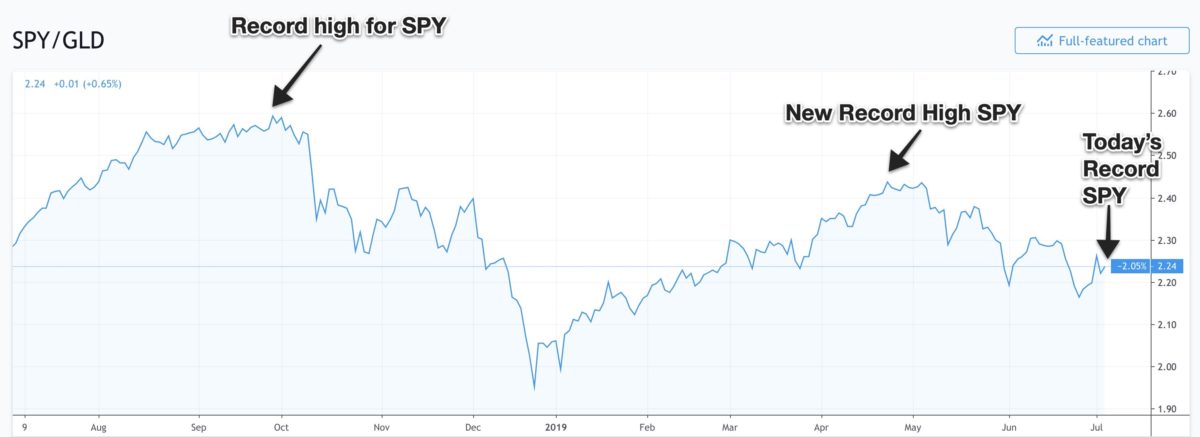
From my perspective, a real equity bull market is one where the stock market, in this case the S&P500, consistently hits new highs relative to what’s historically been the world’s politically-neutral monetary asset, gold;
and the U.S. stock market did exactly that from August 2011 until September 2018.
Though equities in nominal terms bottomed in March 2009, we didn’t really get the all clear in my view until equities started rallying versus gold in late summer 2011.
U.S. stocks continued to hit new highs via this ratio until the most recent high in September 2018. This represented a seven year equity bull market of historic proportions, but since last fall the ratio has consistently lagged nominal highs in stocks as you can see in the chart below.
So what does all of this mean?
It’s too early to tell for sure, but what the chart tells me is there’s a high probability the economic cycle ended and started to turn down last September, and 2019’s nominal highs in equities (May and July) are sending false signals about what’s really going on.
Combine this with the fact that gold recently broke out of a multi-year downtrend and the argument becomes stronger.
Namely, that the cycle really has turned and the macro environment today is far different from what it was during the great 2011-2018 equity bull market
DYI: What does all of this mean?? In my judgement the U.S. economy is going
into a deflationary smash due to corporations topped out on debt, government
borrowing crowding out the private sector along with our citizens up to their
gills in debt causing the demand for money [borrowing] to drop substantially
causing interest rates to dropped off with the U.S. 10 year Treasury bond dropping
for a few sessions trading below 2%!
Further declines will occur as the economy enters [or may have already?]
our next recession. This is what the
stock market as measured against gold is telling us. The long awaited bear is now front and
center. There will be ebbs and flows
[rises and falls] but the overall direction is down for stocks. Gold may sag in the beginning however when
corporate bonds begin their journey into default gold will shine since the
barbaric relic has zero counter party risk!
So
hold onto your hats and your cash better values are ahead. The fireworks are just beginning. When should you begin buying?? Go to Ben Graham’s corner of this blog [see
below] his simple formula will tell you.
Ben Graham's Corner
Margin of Safety!
Central Concept of Investment for the purchase of Common Stocks.
"The danger to investors lies in concentrating their purchases in the upper levels of the market..."
Stocks compared to bonds:
Earnings Yield Coverage Ratio - [EYC Ratio]
EYC Ratio = 1/PE10 x 100 x 1.1 / Bond Rate
1.75 plus: Safe for large lump sums & DCA
1.30 plus: Safe for DCA
1.29 or less: Mid-Point - Hold stocks and purchase bonds.
1.00 or less: Sell stocks - Purchase Bonds
Current EYC Ratio: 1.07 (rounded)
As of 07-01-19
Updated Monthly
Updated Monthly
PE10 as report by Multpl.com
Bond Rate is the rate as reported by
Vanguard Long-Term Investment-Grade Fund Investor Shares (VWESX)
DCA is Dollar Cost Averaging.
Lump Sum any amount greater than yearly salary.
PE10 ..........28.34
Bond Rate....3.65%
Lump Sum any amount greater than yearly salary.
PE10 ..........28.34
Bond Rate....3.65%
Over a ten-year period the typical excess of stock earnings power over bond interest may aggregate 4/3 of the price paid. This figure is sufficient to provide a very real margin of safety--which, under favorable conditions, will prevent or minimize a loss......If the purchases are made at the average level of the market over a span of years, the prices paid should carry with them assurance of an adequate margin of safety. The danger to investors lies in concentrating their purchases in the upper levels of the market.....
DYI
No comments:
Post a Comment